
Clark Johnson on the Banded Iron Formations
Banded Iron Formations (BIFs) are a visually striking group of sedimentary rocks that are iron rich and almost exclusively deposited in the Precambrian. Their existence points to a major marine iron cycle that does not operate today. Several theories have been proposed to explain how the BIFs formed. While they all involve the precipitation of ferric (Fe3+) iron hydroxides from the seawater via oxidation of dissolved ferrous (Fe2+) iron that was abundant when the oceans contained very low levels of free oxygen, they disagree as to how this oxidation occurred. In the podcast, Clark Johnson describes how oxidation could have occurred without the presence of abundant free oxygen in the oceans. This would have produced abundant organic carbon. To explain the absence of this carbon today, he suggests that anaerobic bacteria “respired” the carbon via anoxygenic photosynthesis, in the process oxidizing it to carbon dioxide.
Johnson is a Professor in the Department of Geoscience at the University of Wisconsin-Madison.
Podcast Illustrations
Images courtesy of Clark Johnson unless otherwise noted.

2.5-billion-year-old (Ga) Brockman Iron Formation, Karijini National park, Western Australia.
Exposed in the walls of canyons carved by rivers in the Western Australian outback, the Brockman Iron Formation is representative of the largest BIFs in the world, with layering and banding that varies on scales from sub-mm to meters. Their red color is the result of recent surface weathering of iron oxides.

Detail of a fresh outcrop of the 2.5 Ga Brockman Iron Formation. Here, the major iron mineral is magnetite, and most of the remaining rock is chert (quartz). The sub-mm and mm-scale layering might represent annual deposition (analogous to varves). The cm-scale layering contains dewatering structures formed when the initial iron-silica gels were deposited on the seafloor and compacted during initial lithification.

Detail of a fresh core of the 2.5 Ga Kuruman BIF, South Africa. The core is about 2 cm across. This unit was probably deposited in the same continental margin basin system as the Brockman BIF. In this core, the layers consist of primary hematite, magnetite, and siderite (Fe carbonate), plus chert. Such fresh samples show that BIF mineralogy consists of both oxidized (Fe3+) and reduced (Fe2+) iron. The earliest iron mineral is hematite, indicating the first stage of BIF mineral formation is an oxidative one, where seawater Fe2+ is oxidized to Fe3+. The Fe2+-bearing minerals, magnetite and siderite, indicate a later reductive stage on the seafloor during early diagenesis. This second stage is needed to explain the observation that, on average, BIFs of this age contain about 60% Fe2+ (i.e., reduced iron).

Changes in iron mineralogy through time. In unmetamorphosed iron-rich rocks, including BIFs and related lithologies such as japerlites (hematite+chert) of Archean age, such as the 3.5 Ga Marble Bar Chert (above left), the dominant iron oxide is hematite (Fe3+). By contrast, in rocks of Proterozoic age, such as the ~2.5 Ga Kuruman Iron Formation (above right), magnetite and siderite (both Fe2+) predominate. In both cases, Fe3+ oxides were precipitated initially, which implies that the younger BIFs additionally record a later reductive process to produce the Fe2+ minerals.

Temporal changes in atmospheric oxygen and BIF deposition (top graph) and estimates for growth of the continental crust (100% equals modern volume, bottom graph). In the graphs, time advances from old at right to young at left.
BIFs older than 2.7 Ga are very small; one of the oldest BIFs, the 3.7 Ga rocks at Isua Greenland, do not even plot on the presented scale. The very large BIFs deposited at the end of the Archean and early Paleoproterozoic, ~2.7-2.4 Ga age, include the Brockman and Kuruman BIFs, which were deposited before the "Great Oxidation Event" at ~2.3 to 2.4 Ga. We also know that the photic zone of the oceans started to become oxidized as early as 3.2 Ga. Thus, oxidation of seawater Fe2+ as part of the deposition of the very large ~2.7-2.4 Ga BIFs could have occurred either by oxygenic photosynthesis or by an anoxygenic photosynthetic pathway or some combination. Meanwhile, although the rate of continental crust formation over time is uncertain, all models suggest an increase in continental crust over time. As explained in the podcast, continental shelves provide the environments for BIF deposition and preserve them from subduction. They may also reflect a driver for a biological role through increased nutrient supply via continental weathering.
Graphic by Clark Johnson. Data sources: Belousova et al. (2010) Lithos. 119:457-466; Dhuime et al. (2012) Science. 335:1334-1336; Konhauser et al. (2017) Earth-Science Rev. 172:140-177.
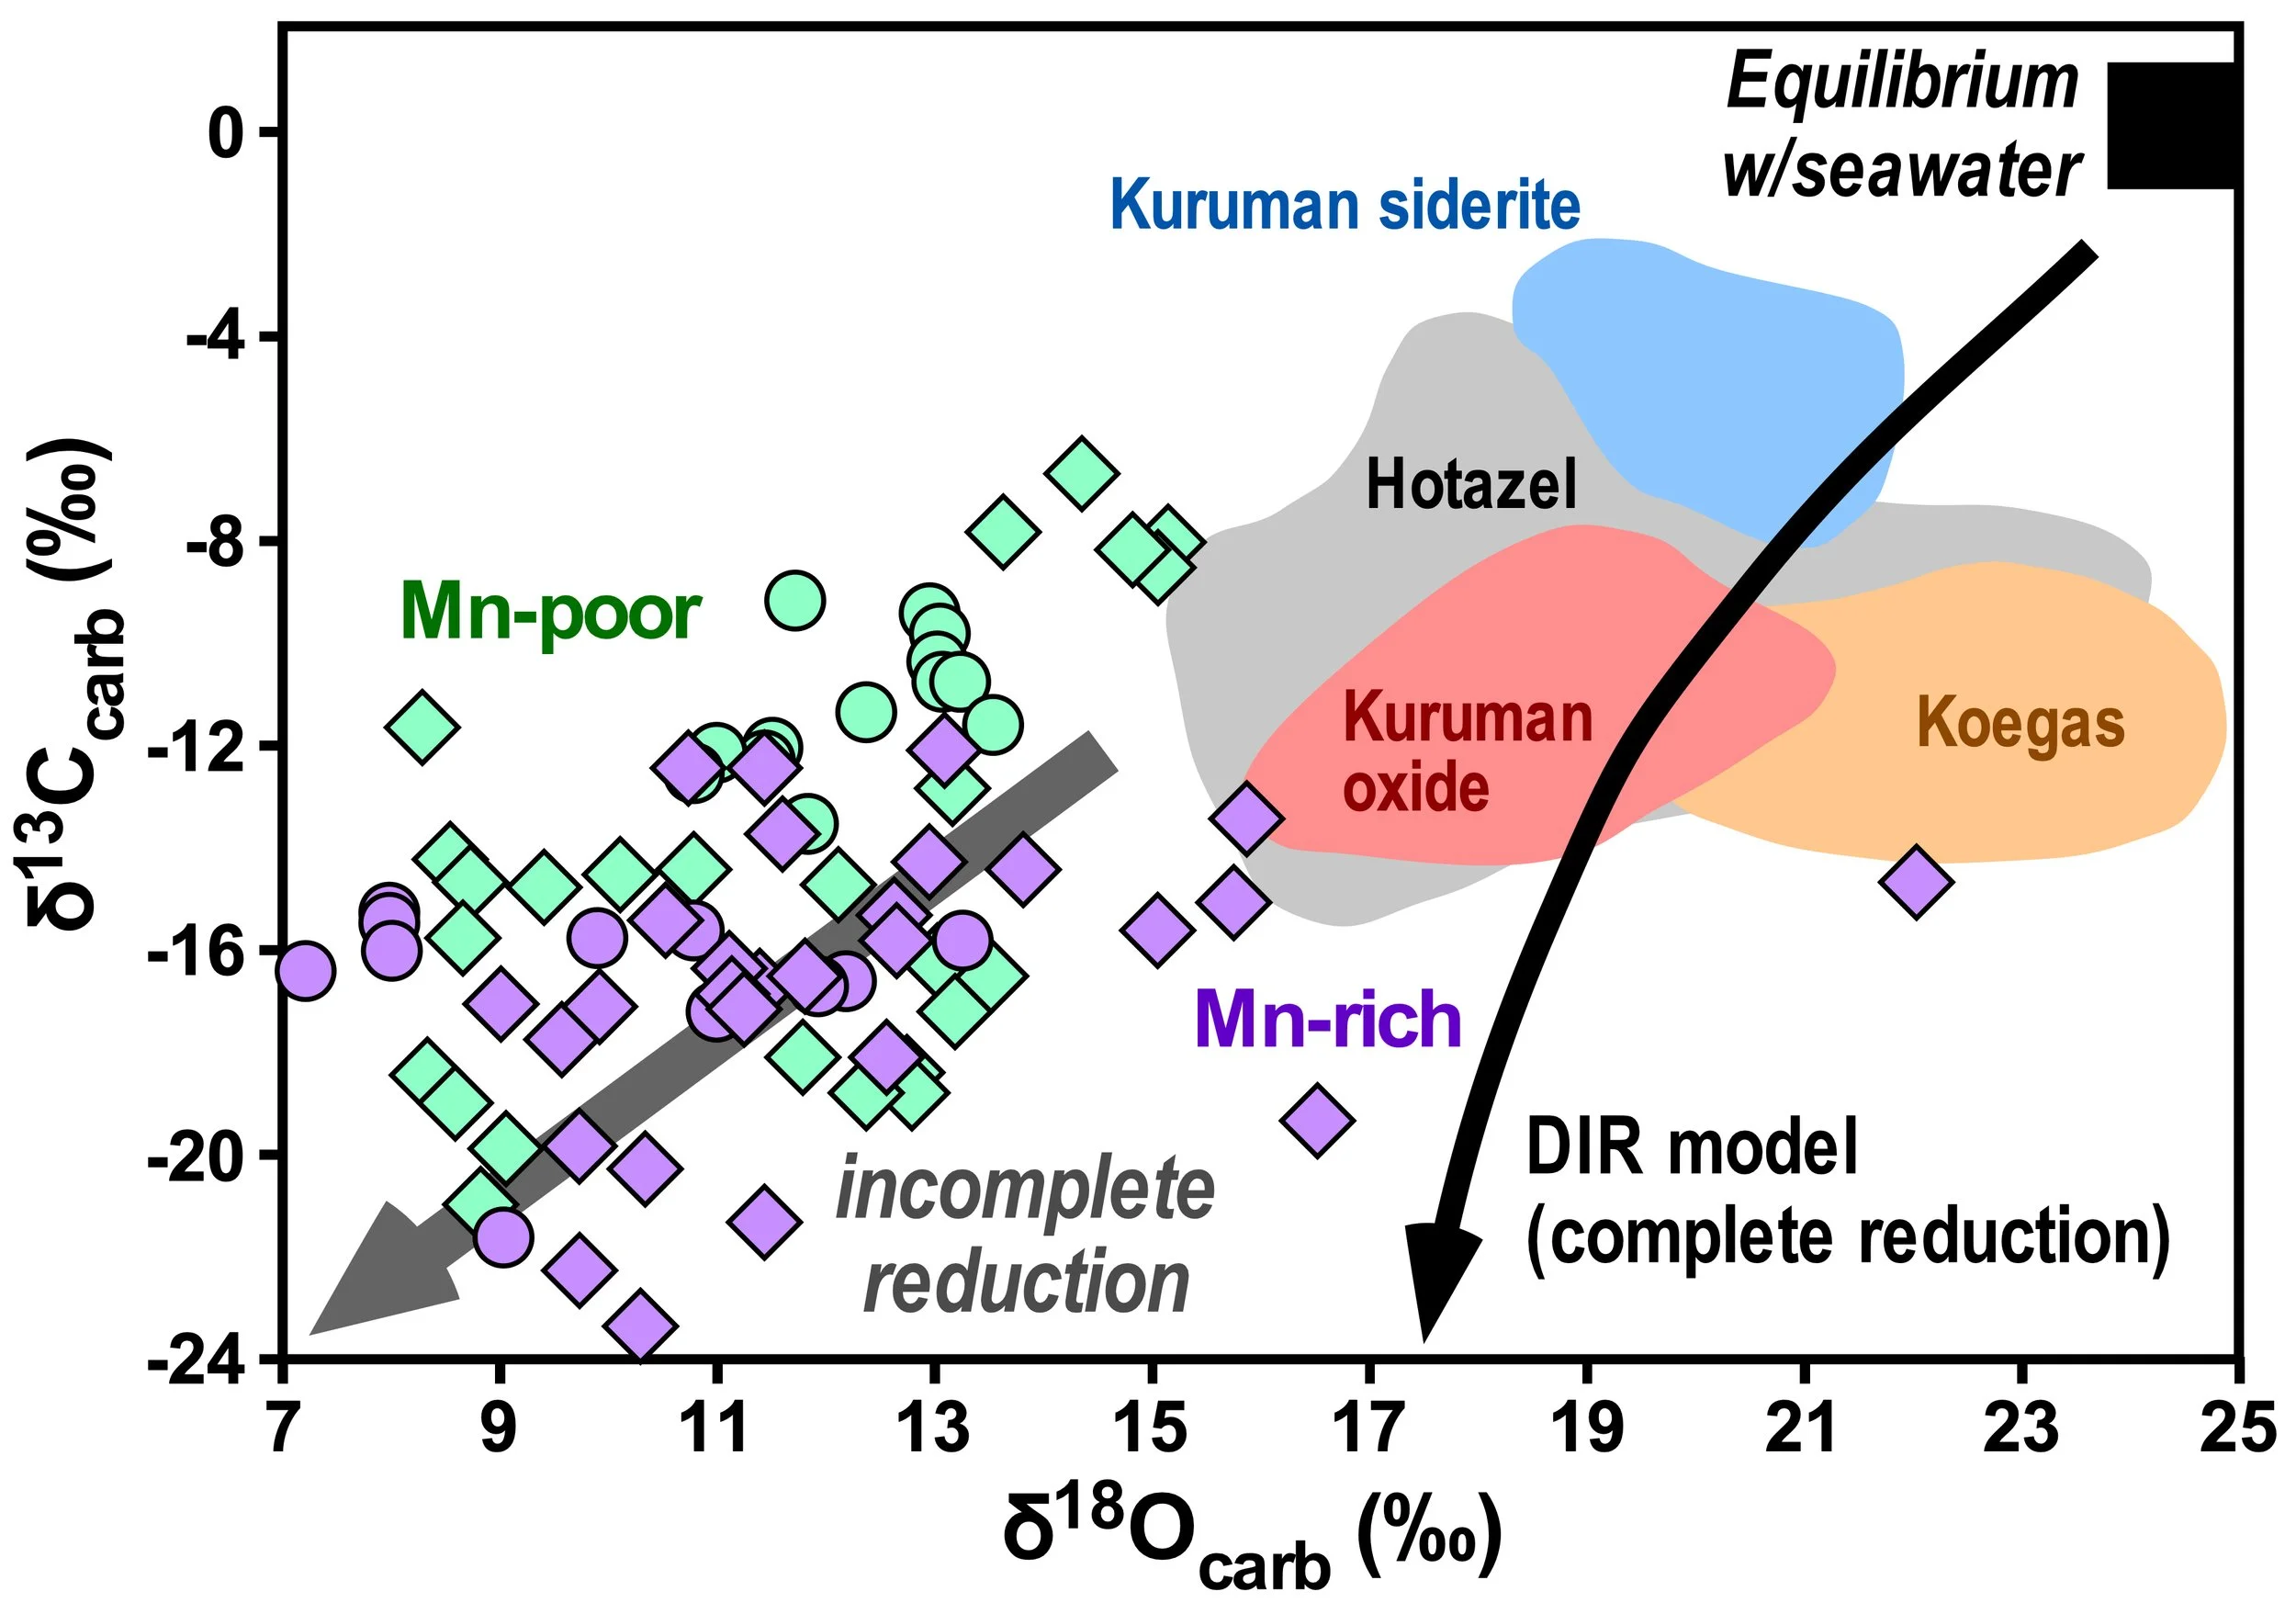
<CAPTION TO BE EDITED> Carbon and oxygen isotope relations for BIF carbonates (siderite and other iron-rich carbonates) for ~2.5 Ga BIFs (colored fields) and 2.9 Ga BIFs (Symbols). Black curve is trend for microbial Fe3+ reduction (Dissimilatory Iron Reduction; "DIR"), run to completion (requiring a mixture of organic carbon and seawater carbonate) and grey arrow is trend for incomplete DIR (minimal seawater carbonate contribution). In all cases, none of the C and O isotope compositions are in equilibrium with seawater, and this is confirmed by Sr isotope studies. These relations provide powerful evidence that microbial iron reduction is responsible for producing the iron carbonates in BIFs. Figure from Johnson et al. (2020) Iron Geochemistry: An Isotopic Perspective, Springer, 360 p.
Detailed notes:
The reactions for microbial dissimilatory iron reduction can be written in several ways, depending upon the relative contributions of organic C and seawater carbonate to the C isotope composition of siderite. Complete reduction, which requires seawater carbonate, can be written as:
4Fe(OH)3 + CH2O + 3HCO3- ➔ 4FeCO3 + 3OH- + 7H2O

CAPTION TO BE EDITED Iron isotope relations among coexisting magnetite, hematite, and siderite in BIFs, as measured at various scales, from g- and mg-size samples to in situ measurements. If these minerals were in Fe isotope equilibrium, as might be expected if they co-precipitated abiologically on the seafloor, all of the data should scatter about the red lines, and clearly this is not the case. On the other hand, if magnetite and siderite formed by Dissimilatory Iron Reduction (DIR) of hematite, they should scatter about the 1:1 grey lines. Many data plot between the DIR and equilibrium lines, indicating variable contributions of Fe from a microbial process and a seawater component. Figure from Johnson et al. (2020) Iron Geochemistry: An Isotopic Perspective, Springer, 360 p.
Superimposed on these relations is a correlation between the absolute δ56Fe values and Nd isotope compositions, where the initial Fe3+ precipitates had different Fe2+ sources prior to the initial oxidation in the photic zone: High δ56Fe values have positive εNd values indicating a hydrothermal source, whereas low δ56Fe values have negative εNd values indicating a microbial Fe2+ source from the continents (DIR shuttle). In summary, therefore, the Fe isotope composition of the initial Fe3+ hydroxides (converted to hematite during dewatering) is established by the source of Fe2+ in the oceans (continental versus hydrothermal), whereas the Fe isotope relations among coexisting magnetite, hematite, and siderite reflects, in part, a microbial component during diagenesis.