
Claudio Faccenna on the Dynamics of Subduction Zones
Listen here or wherever you get your podcasts.

Subduction zones can be very long-lived, persisting for tens or even hundreds of millions of years. During that time, they rarely stay still, but instead retreat, advance, move laterally, or reverse direction. In the podcast, Claudio Faccenna discusses the processes that govern these movements. It turns out that they depend not only on the properties of the subducting slab, but also on the environment, including the proximity of other subduction zones.
Faccenna has been studying how convergent margins evolve for over 30 years, concentrating particularly on the Mediterranean region. He is Head of the lithospheric dynamics section at the Helmholtz Center for Geosciences at GFZ in Potsdam in Germany and also a Professor at the Department of Science at Roma Tre University.
Podcast Illustrations
Images courtesy of Claudio Faccenna unless otherwise noted.
Forces Acting Upon a Subducting Plate
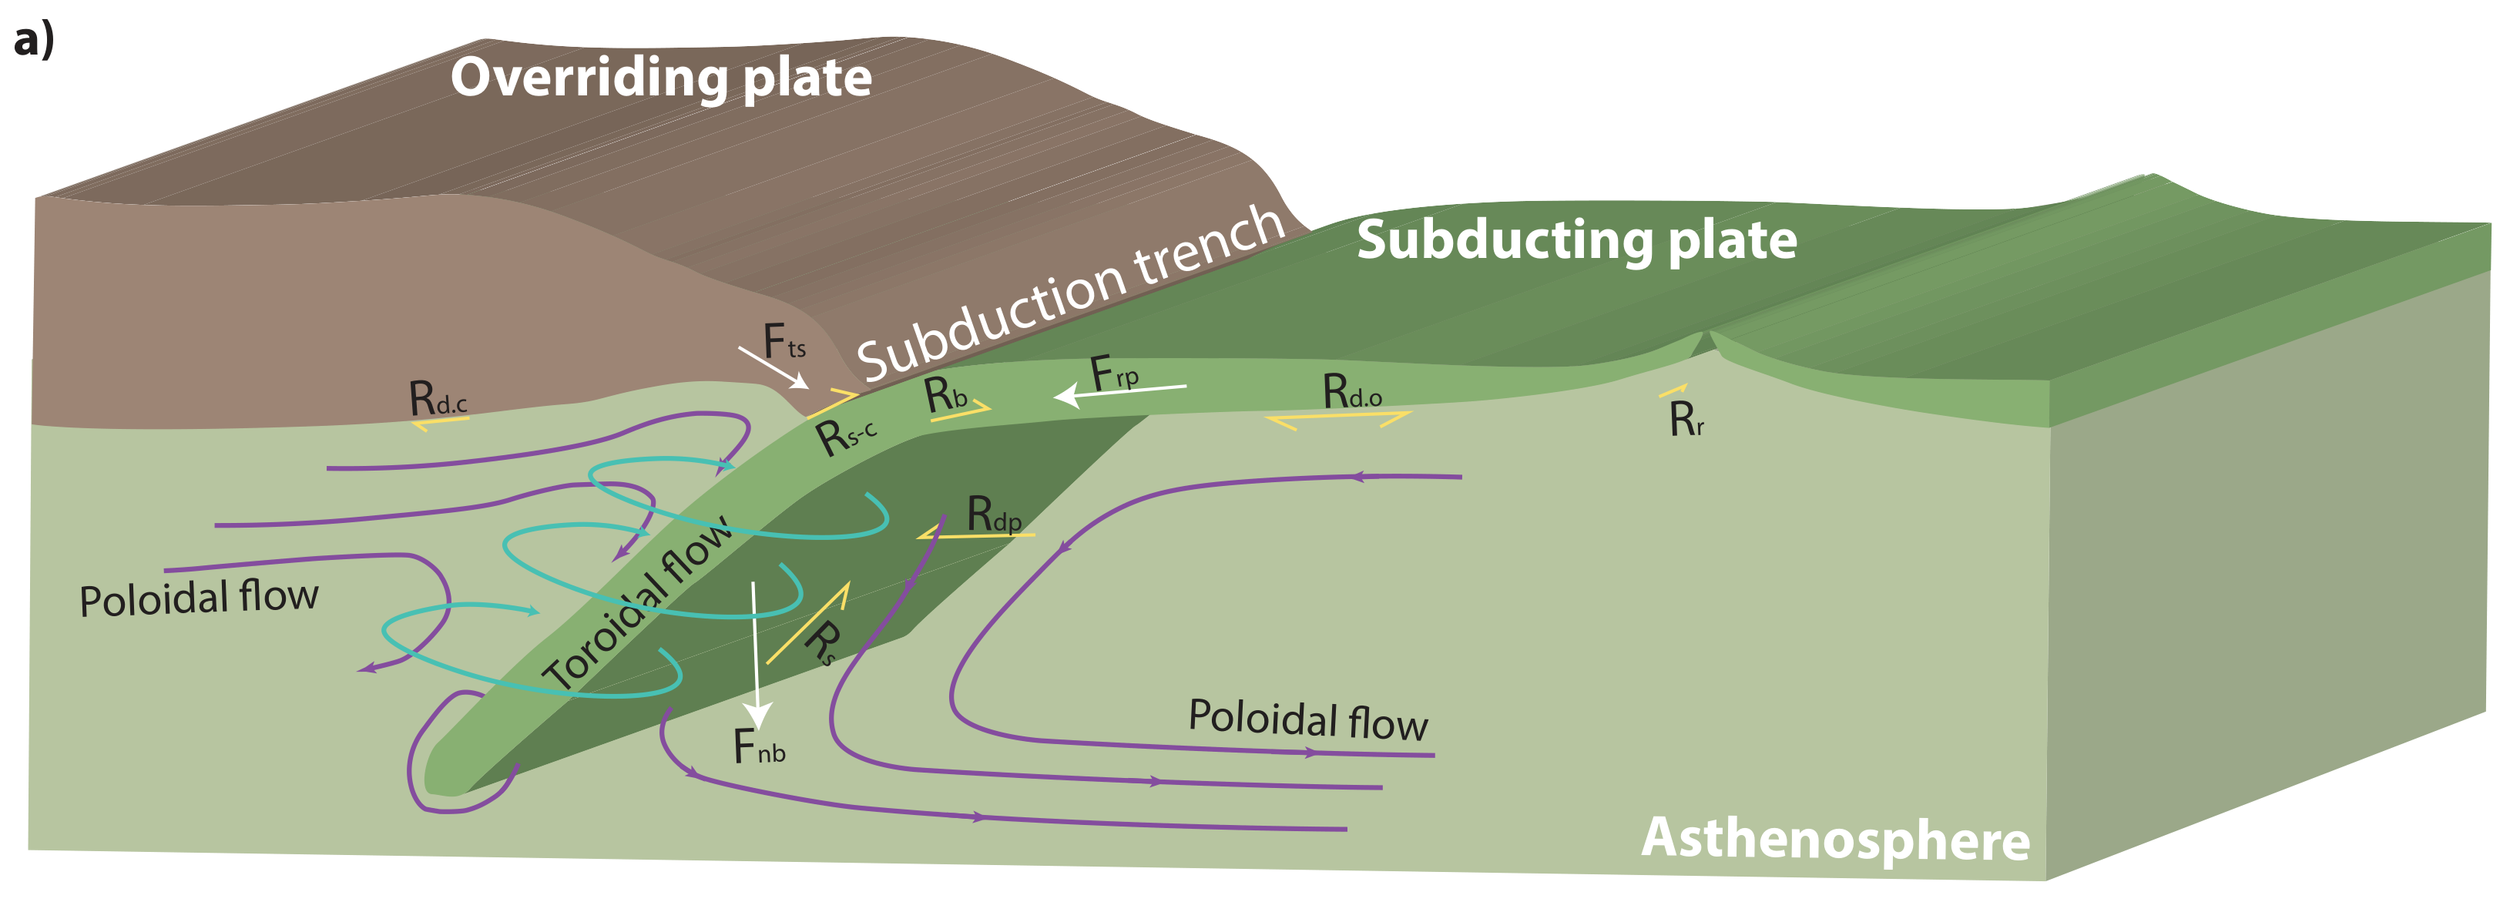
Geodynamics of a subduction zone showing driving and resisting forces and the typical mantle flow pattern created by the descending slab (modified after Forsyth and Uyeda, 1975; Magni et al., 2024). Pull on the slab (Fnb) caused by the negative buoyancy of the subducting lithosphere is the main driving force of plate motion and is estimated to be about an order of magnitude greater than ridge push (Frp). Fnb stems from the increasing density of the lithosphere as it thickens and cools as it moves away from the spreading ridge. Another driving force is trench suction (Fts). Resisting forces (yellow arrows) include mantle drag (Rd.o), resistance at the subduction interface (Rs-c), bending resistance (Rb), mantle resistance along the slab (Rs,), resistance force due to dynamic pressure (Ra) and mantle resistance on the ridge (Rr).
Modified from Magni, V., et al. (2025), Nat Rev Earth Environ 6, 51–66 https://doi.org/10.1038/s43017-024-00612-3
Depth Profiles of Subducting Slabs
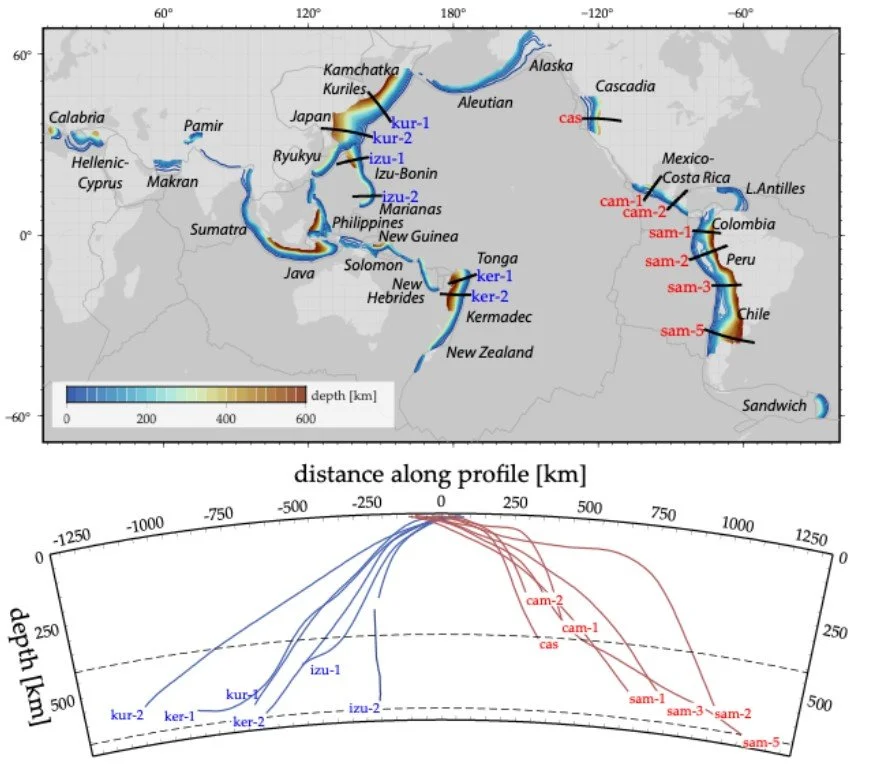
Top: map of subduction zone locations. Bottom: depth profiles of Pacific subduction zones. Western Pacific subduction zones, which subduct toward the west, are drawn in blue, and eastern Pacific subduction zones, which subduct toward the east, are drawn in red. Dashed lines indicate depths of 410 km and 660 km, which correspond to mantle transition zones where the seismic velocity, mineral phases, density, and viscosity change. Zero on the distance scale corresponds to proximity to the coastline. The figure shows that the shapes of the subducting slabs vary considerably. This is thought to result from the interaction of several factors, including the slab's properties, the mantle's characteristics, and forces on the plate.
Becker, T and Faccenna, C. (2025), Tectonic Geodynamics, Princeton University Press
Western Pacific and Indonesian Subduction Zones

The figure shows sections of P-wave tomography anomalies along the yellow lines on the map (Fukao & Obayashi, 2013), seismicity (orange dots on profiles; Engdahl et al., 1998), plate velocities (orange vectors; Argus et al., 2011), and volcanoes (cyan inverted triangles; Siebert & Simkin, 2023). The Western Pacific and Japan subduction zones (the two most northerly zones) do not appear to penetrate the lower mantle, unlike those of Indonesia and Kermadec (north of New Zealand). Whether a slab penetrates the lower mantle depends on factors such as the duration of subduction and the angle at which the slab reaches the 660-km discontinuity, with steeper angles favoring descent.
Becker, T and Faccenna, C. (2025), Tectonic Geodynamics, Princeton University Press
Subduction Zones Along the West Coast of the Americas
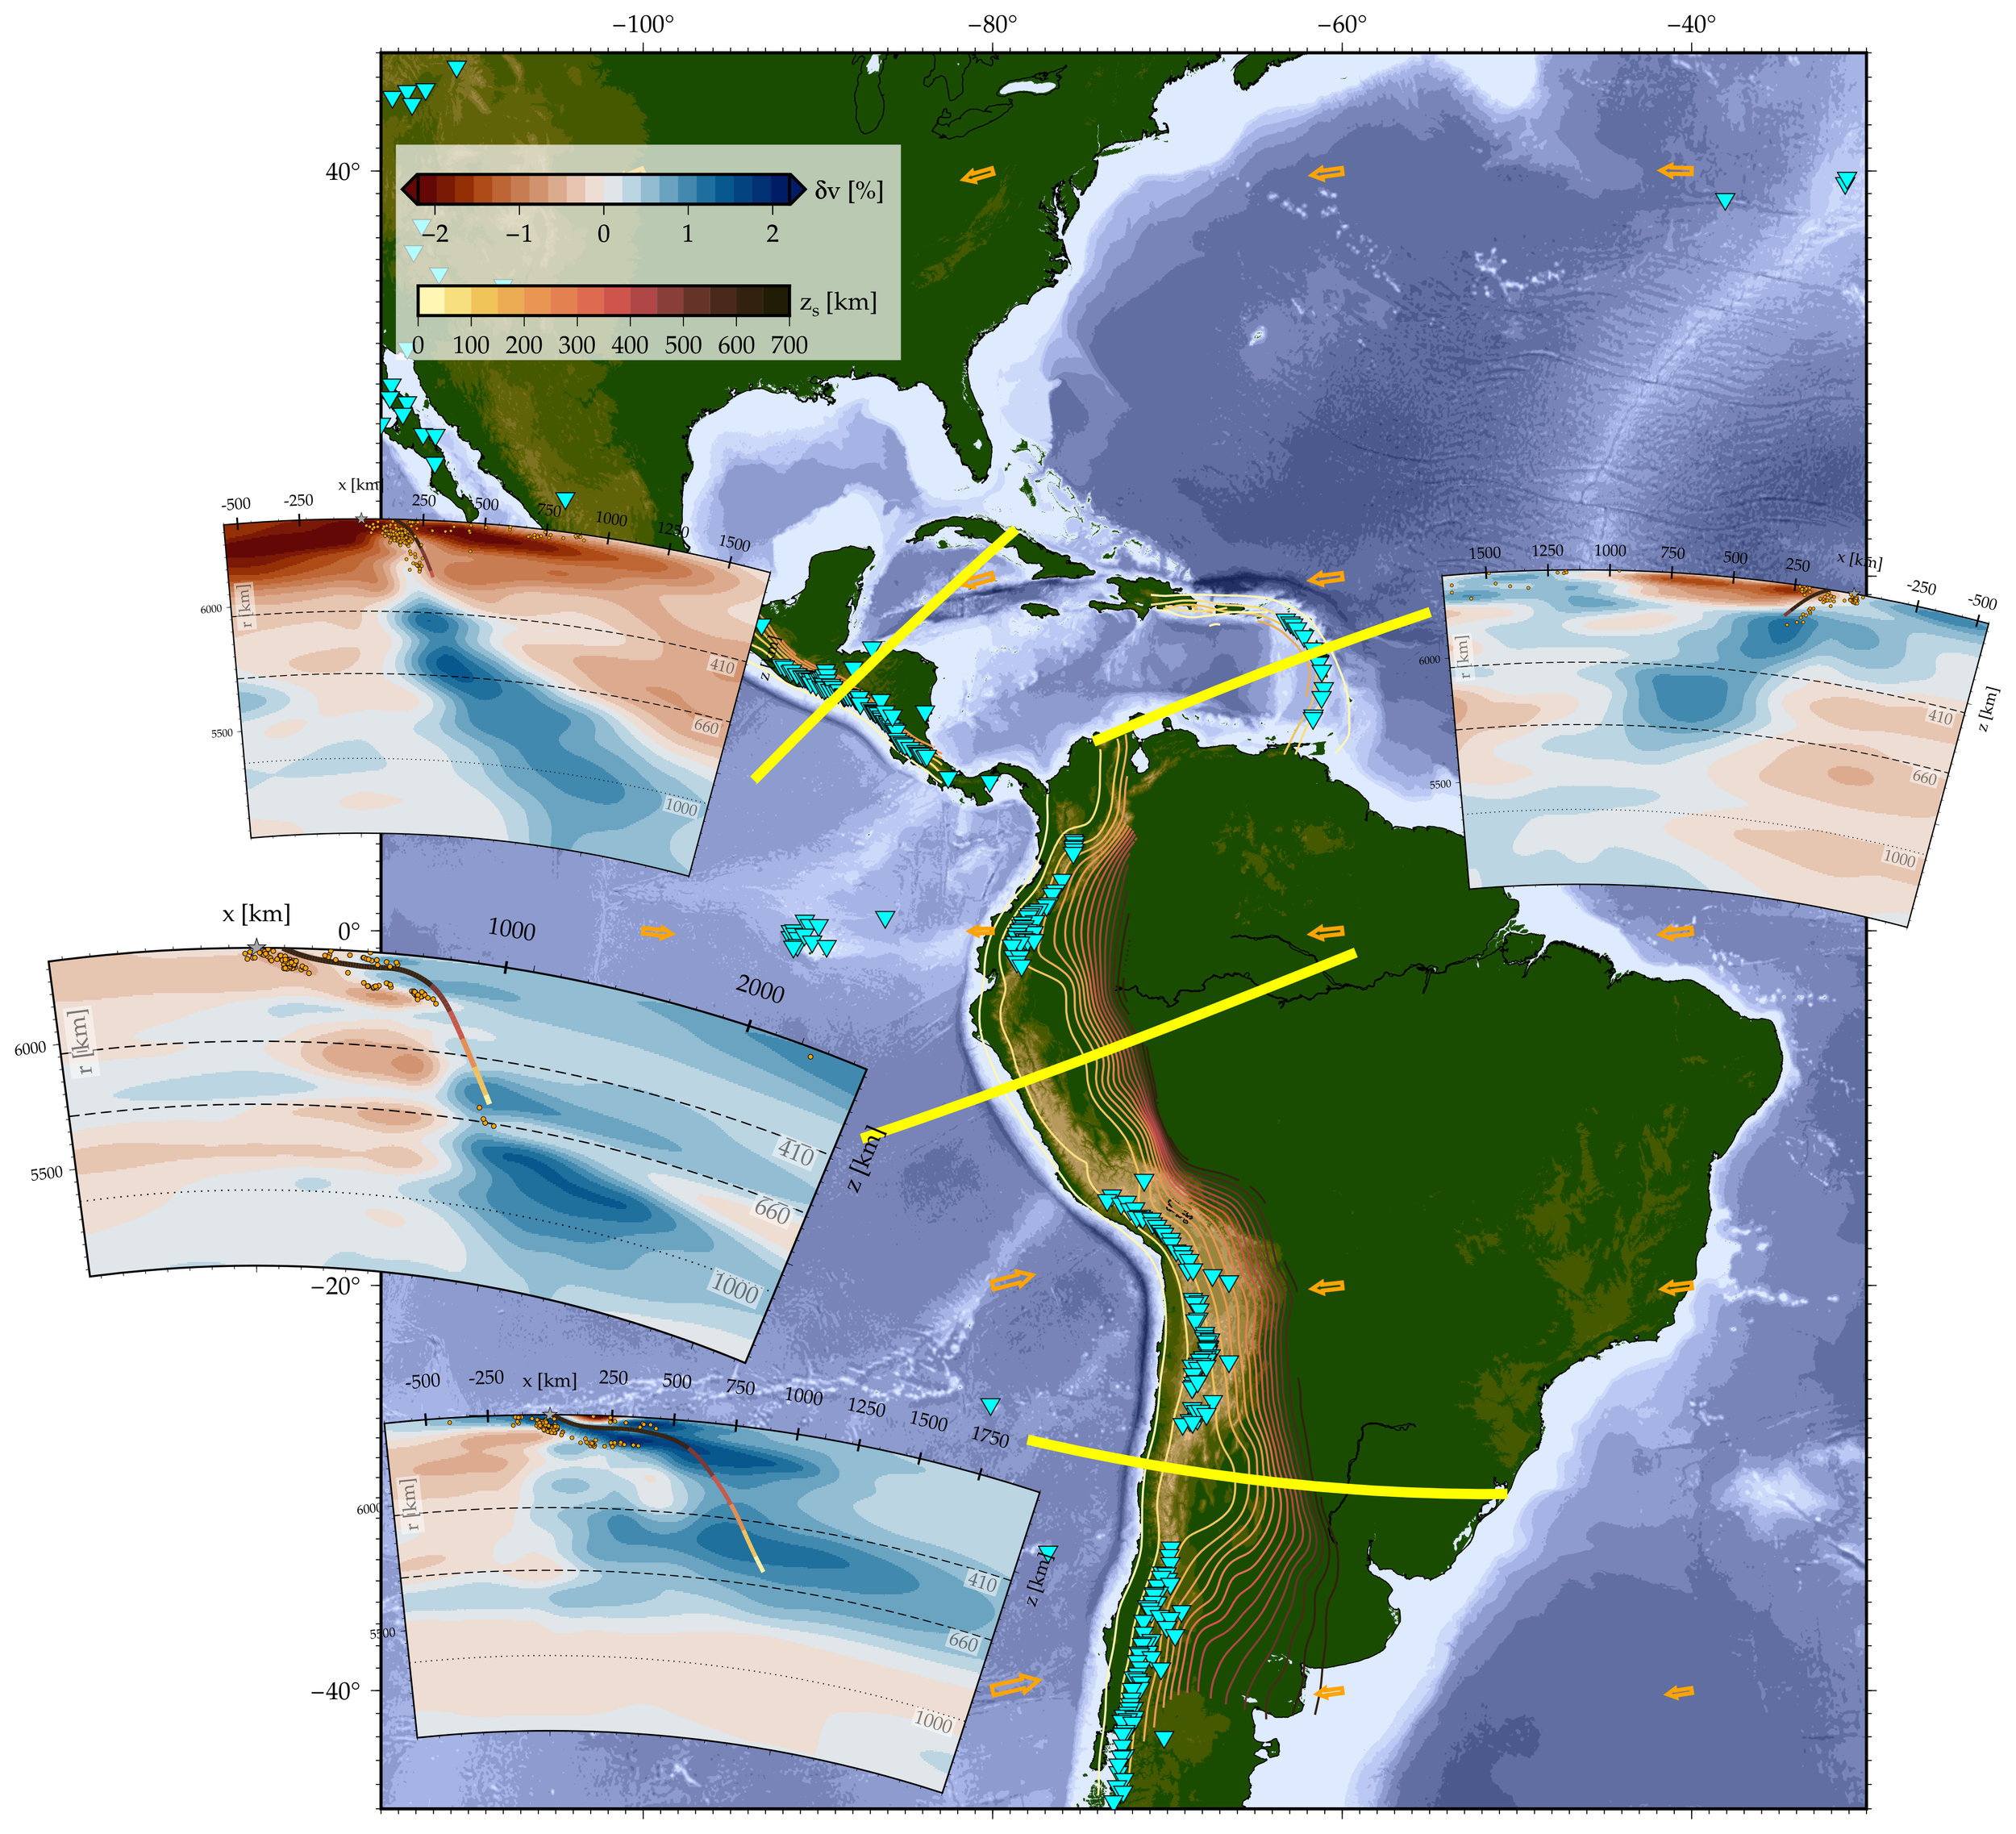
Subduction zones along the west coast of the Americas. In the podcast, Faccenna describes how the slab subducting below the Andes has entered the lower mantle where its lateral movement is restricted by the higher viscosity there. The subduction zones beneath northern South America and Central America show evidence of penetration into the lower mantle, reaching depths of 1,300 km or more. By contrast, the younger Caribbean subduction zone does not.
Becker, T and Faccenna, C. (2025), Tectonic Geodynamics, Princeton University Press
Numerical Simulation of Slab Rollback
Three-dimensional numerical simulation of a subduction zone and the associated mantle flow (white arrows) induced by rollback (i.e., retreat) of the slab. Color indicates pressure in the lithosphere with blue and red indicating compressional and extensional pressures respectively. The simulation shows how lateral mantle flow moves away from beneath the slab and circulates around its edge in a toroidal pattern. The third dimension of the subduction zone—its length—appears to be a critical parameter. Smaller slabs are expected to retreat faster than larger ones and not penetrate into the lower mantle, thus being relatively free to migrate backward.
Holt, A. F. et al. (2017), Geophysical Journal International, 209(1), 250
Izu-Bonin-Marianas Back-arc Basin

Left: map showing seafloor ages in the western Pacific. The back-arc basins shown appear mainly as the red and orange regions, i.e., having the youngest ages of 0 and 30 million years. Center: more detailed seafloor-age map of the Izu-Bonin-Marianas region. Right: P-wave tomography sections along the green lines labeled A, B, and C, revealing the varying shape of the subduction zone going from north to south.
The western Pacific subduction zone is characterized by back-arc extension in the overriding plate that began within the last 30 million years (left panel). Tomography and seismicity data show that along the Izu–Bonin region (section B1–B2), a double subduction system is present, resulting from subduction of both the Pacific Plate (to the east) and the Philippine Plate (to the west).
Becker, T and Faccenna, C. (2025), Tectonic Geodynamics, Princeton University Press
Izu-Bonin Subduction Zone
The Izu–Mariana subduction system is unique in that the trench is advancing toward the overriding plate (right panel). Bottom left: tomographic section along the red line on the map at right shows the two subducting slabs. Top left: numerical model of single subduction and double subduction. The double-subduction simulation replicates quite a few features appearing on the tomographic section, such as the apparent flattening out of the subducting slabs between the depths of 400 and 600 km. In a single-slab system, the trench migrates backward, whereas in a double-slab system, the rear slab drives trench advance. The simulation also reproduces the tomographic section (bottom left, section along the red line on the map at right), which clearly shows the presence of two subducting slabs.
Faccenna, C. et al. (2018), Tectonophysics, 746, 229
Numerical Simulation of Same-Polarity Double-Subduction Zone
Three-dimensional numerical simulation of a double-subduction zone with both subducting slabs dipping in the same direction. The rear trench advances while the front one rolls back. Color indicates pressure in the lithosphere with blue and red indicating compressional and extensional pressures respectively. A version of such a simulation may help us understand the double subduction zone in the Izu-Bonin-Marianas region shown in the previous figure.
Holt, A. F. et al. (2017), Geophysical Journal International, 209(1), 250
Subducting Slab Penetration of the Lower Mantle
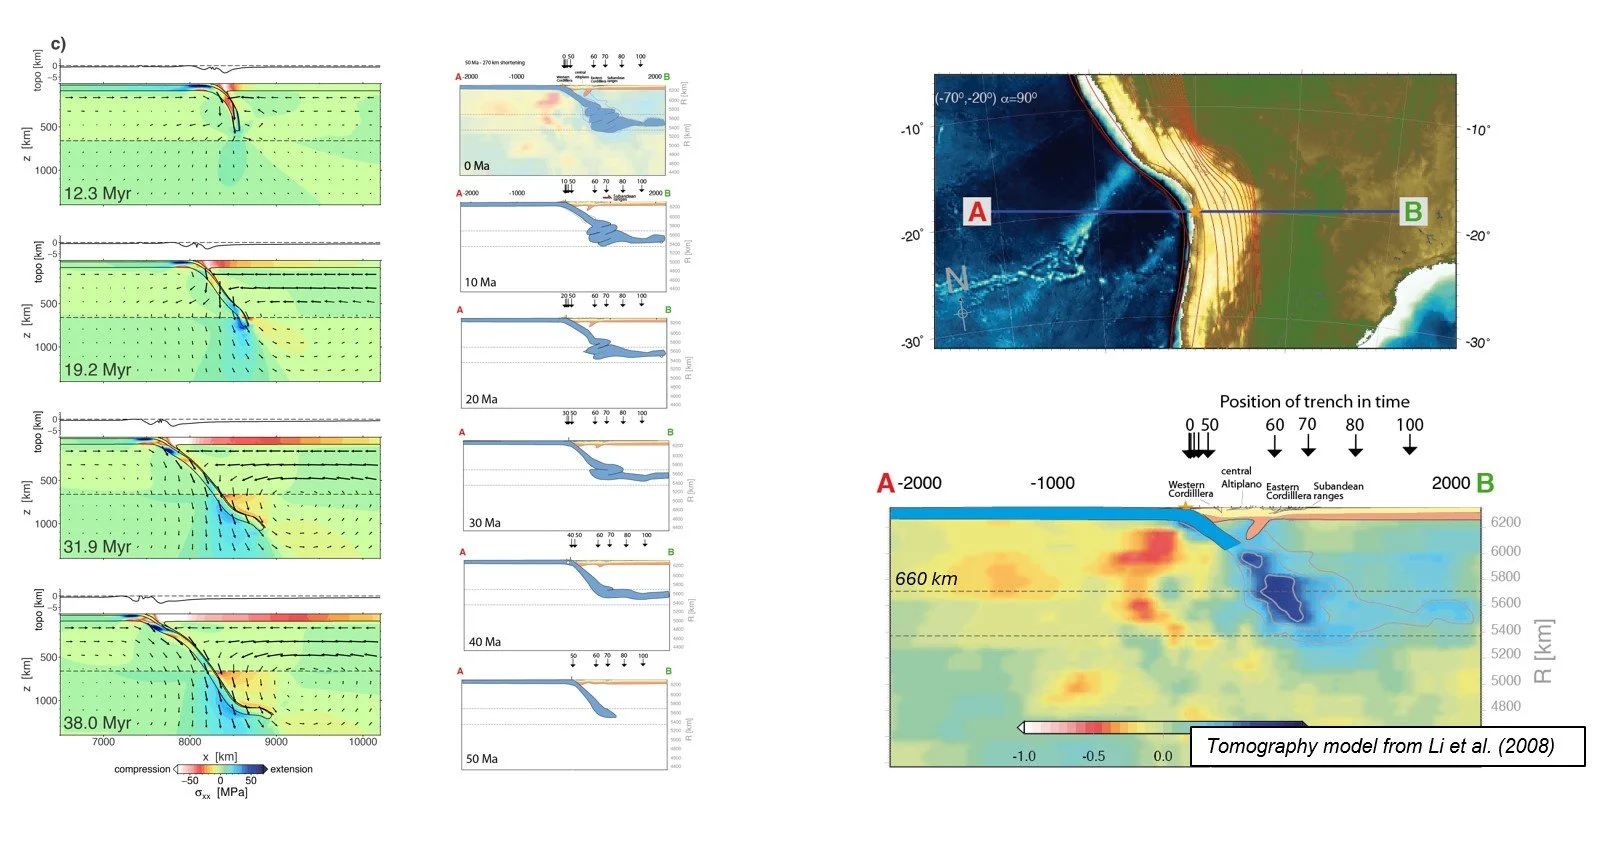
The origin of the Andes is intriguing as this major mountain belt formed without a collision between two continental plates, unlike the Alpine–Himalayan belt. Numerical simulations (left panel) of subduction dynamics, combined with tectonic reconstructions (central panel), show slab penetration into the lower mantle beneath the central Andes. In the model, rollback velocity decreases once the slab becomes anchored in the lower mantle, leading to widespread compression in the overriding plate (shown in white in the upper plate, left panel). In the Central Andes, slab rollback slows and eventually becomes slower than the westward motion of South America, causing compression in the upper plate.
Faccenna, C. et al. (2017), Earth and Planetary Science Letters, 463, 189
Further Reading
Becker, T. and Faccenna, C. (2025), Tectonic Geodynamics, Princeton University Press