
Dan McKenzie on What Venus Tells Us About the Earth

Dan McKenzie at a fault fissure splitting apart earlier basalt lava flows at Grjotágrá, NE Iceland.
Courtesy of James Jackson
Dan McKenzie is Emeritus Professor of Geophysics, Geodynamics and Tectonics at Cambridge University. Though best known for his discovery of Plate Tectonics, he has also made fundamental contributions to subjects as varied as how rocks melt and how you can tell where they came from by their isotopic and rare-earth composition; the origin of sedimentary basins like the North Sea and continental margins (with major impact on the oil industry); the gravity field and tectonics of the Earth, Moon, Mars and Venus; the organic geochemistry of hydrocarbons; convection in the Earth's mantle; mapping the thickness variations of the Earth's lithosphere with seismic tomography; and the deformation of the continents.
Listen to the podcast here, or wherever you get your podcasts.
Scroll down for illustrations that support the podcast. Comment on this podcast at the bottom of the page.
Note - playing the podcast is not supported on Internet Explorer; please use any other browser, or listen on Spotify, Apple Podcasts, etc.
Podcast Illustrations

The Magellan spacecraft being released from the Space Shuttle in 1989. All the topographic measurements were made by the altimeter, which is the conical object attached to the side of the dish antenna. It pointed directly downwards, and the dish pointed to one side when it was mapping. The dish was used both to capture radar data for imaging the Venusian surface, and also to transmit the data back to Earth. Dan McKenzie used the Doppler fluctuations in this signal to determine the local gravity field.
Image courtesy of NASA
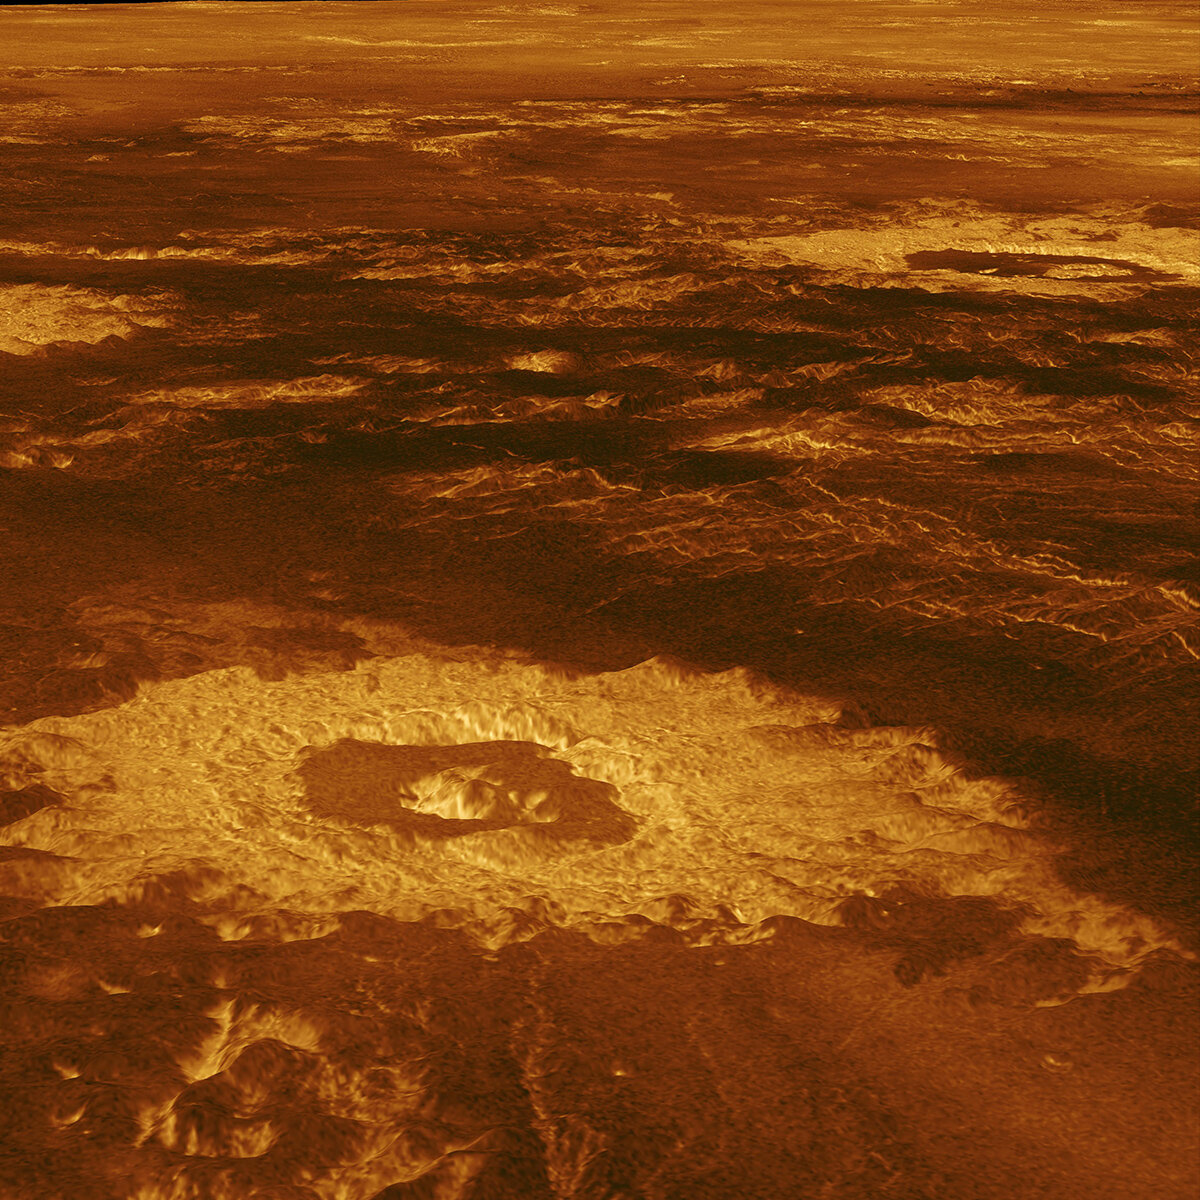
Radar image of Venus from Magellan showing a perspective rendering of the topography data that was correlated with the gravity field data as described in the podcast. The image shows two craters formed by the impact of meteorites.
Courtesy of NASA/JPL

Rendering of the topography of Venus and the Earth. The two planets are roughly the same size.
Courtesy of NASA

Ultraviolet image of the atmosphere of Venus showing the dense clouds of sulfuric acid droplets.
Taken by Pioneer Venus Orbiter in 1979, courtesy of NASA

The large-scale (more than 700 km) topography of Venus from the Magellan spacecraft. At these larger scales, the effect of elastic support on the topography disappears. The box indicates the Atla region shown in the images below.

The large scale (more than 700 km) gravity field of Venus inferred from the Doppler measurements of the radio signals from Magellan. At these scales, the effect of elastic support on the gravity disappears, so what remains is the gravity field caused by convection of the underlying mantle. It reveals a pattern of convection cells.

Map of the large-scale topography with the effect of convection of the mantle below the elastic plate removed. Since elastically supported topography is not significant at these scales, what remains is the topography supported by buoyancy - like a floating iceberg, but here it is the Venusian plate (the layer of crust and mantle that does not take part in the convective flow) floating in the mantle below. Most of the topography in the Atla region has disappeared, indicating that Atla is almost entirely supported by mantle convection.
Detailed Maps of the Atla Region of Venus

Atla region topography at all scales. One degree of latitude is approximately 100 kilometers, and the map covers an area of about 3,700 km square.

Map of the large-scale (more than 700 km) part of the gravity field, revealing the pattern of convection in the interior of Venus.

Map of the elastic topography, which is the real topography minus the topography caused by convection of the mantle below the surface plate. The map reveals the downward flexing of the plate around the big volcano towards the lower left (around 0, -165) where it elastically supports the extra mass of the volcano. The linear features in this map look like a map of rift valleys in Africa, suggesting that in these regions the plates of Venus and the Earth have similar elastic thicknesses.
All maps courtesy of Dan McKenzie
Diagrams explaining the relationship between topography, gravity, and horizontal scale on the planetary surface
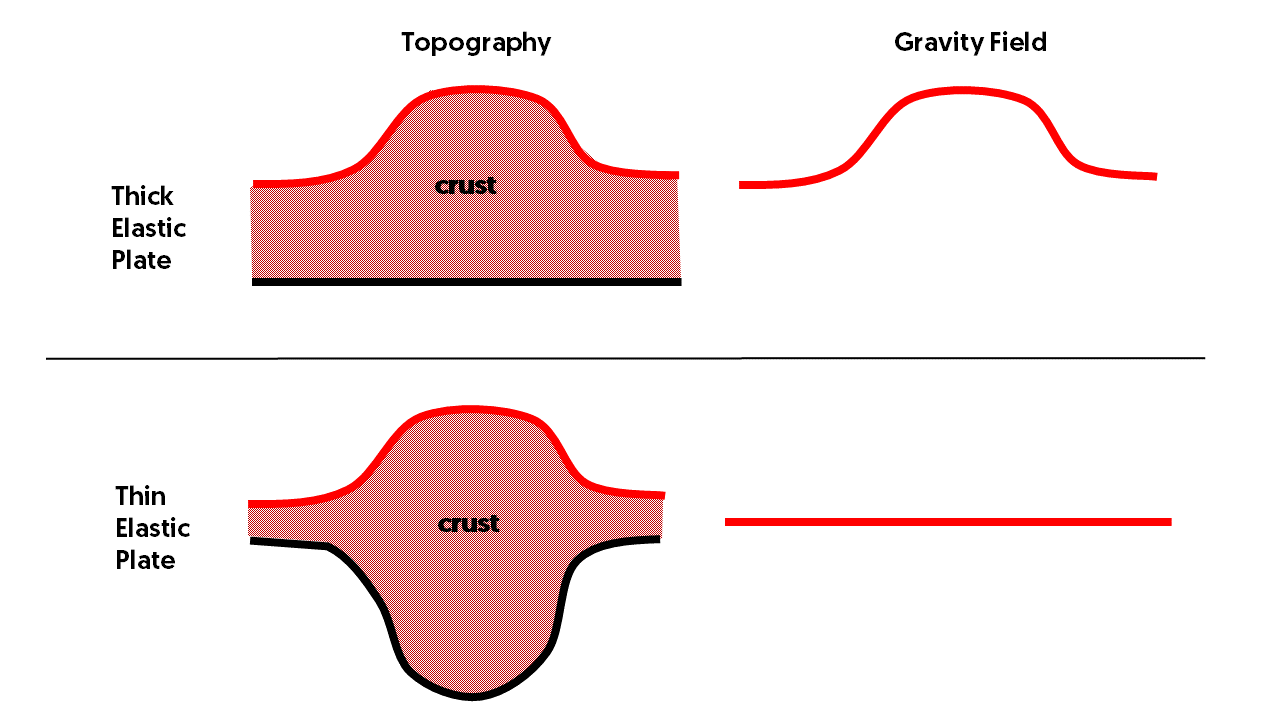
Diagram contrasting the relationship between the topography and the gravity field for a thick elastic plate and for a thin elastic plate. For the thick plate, the topography is fully supported by the plate, resulting in a gravity field that follows the topography. For a thin plate, in which the topography is fully compensated (no elastic support), the topography has no effect on the gravity, as with a floating iceberg.
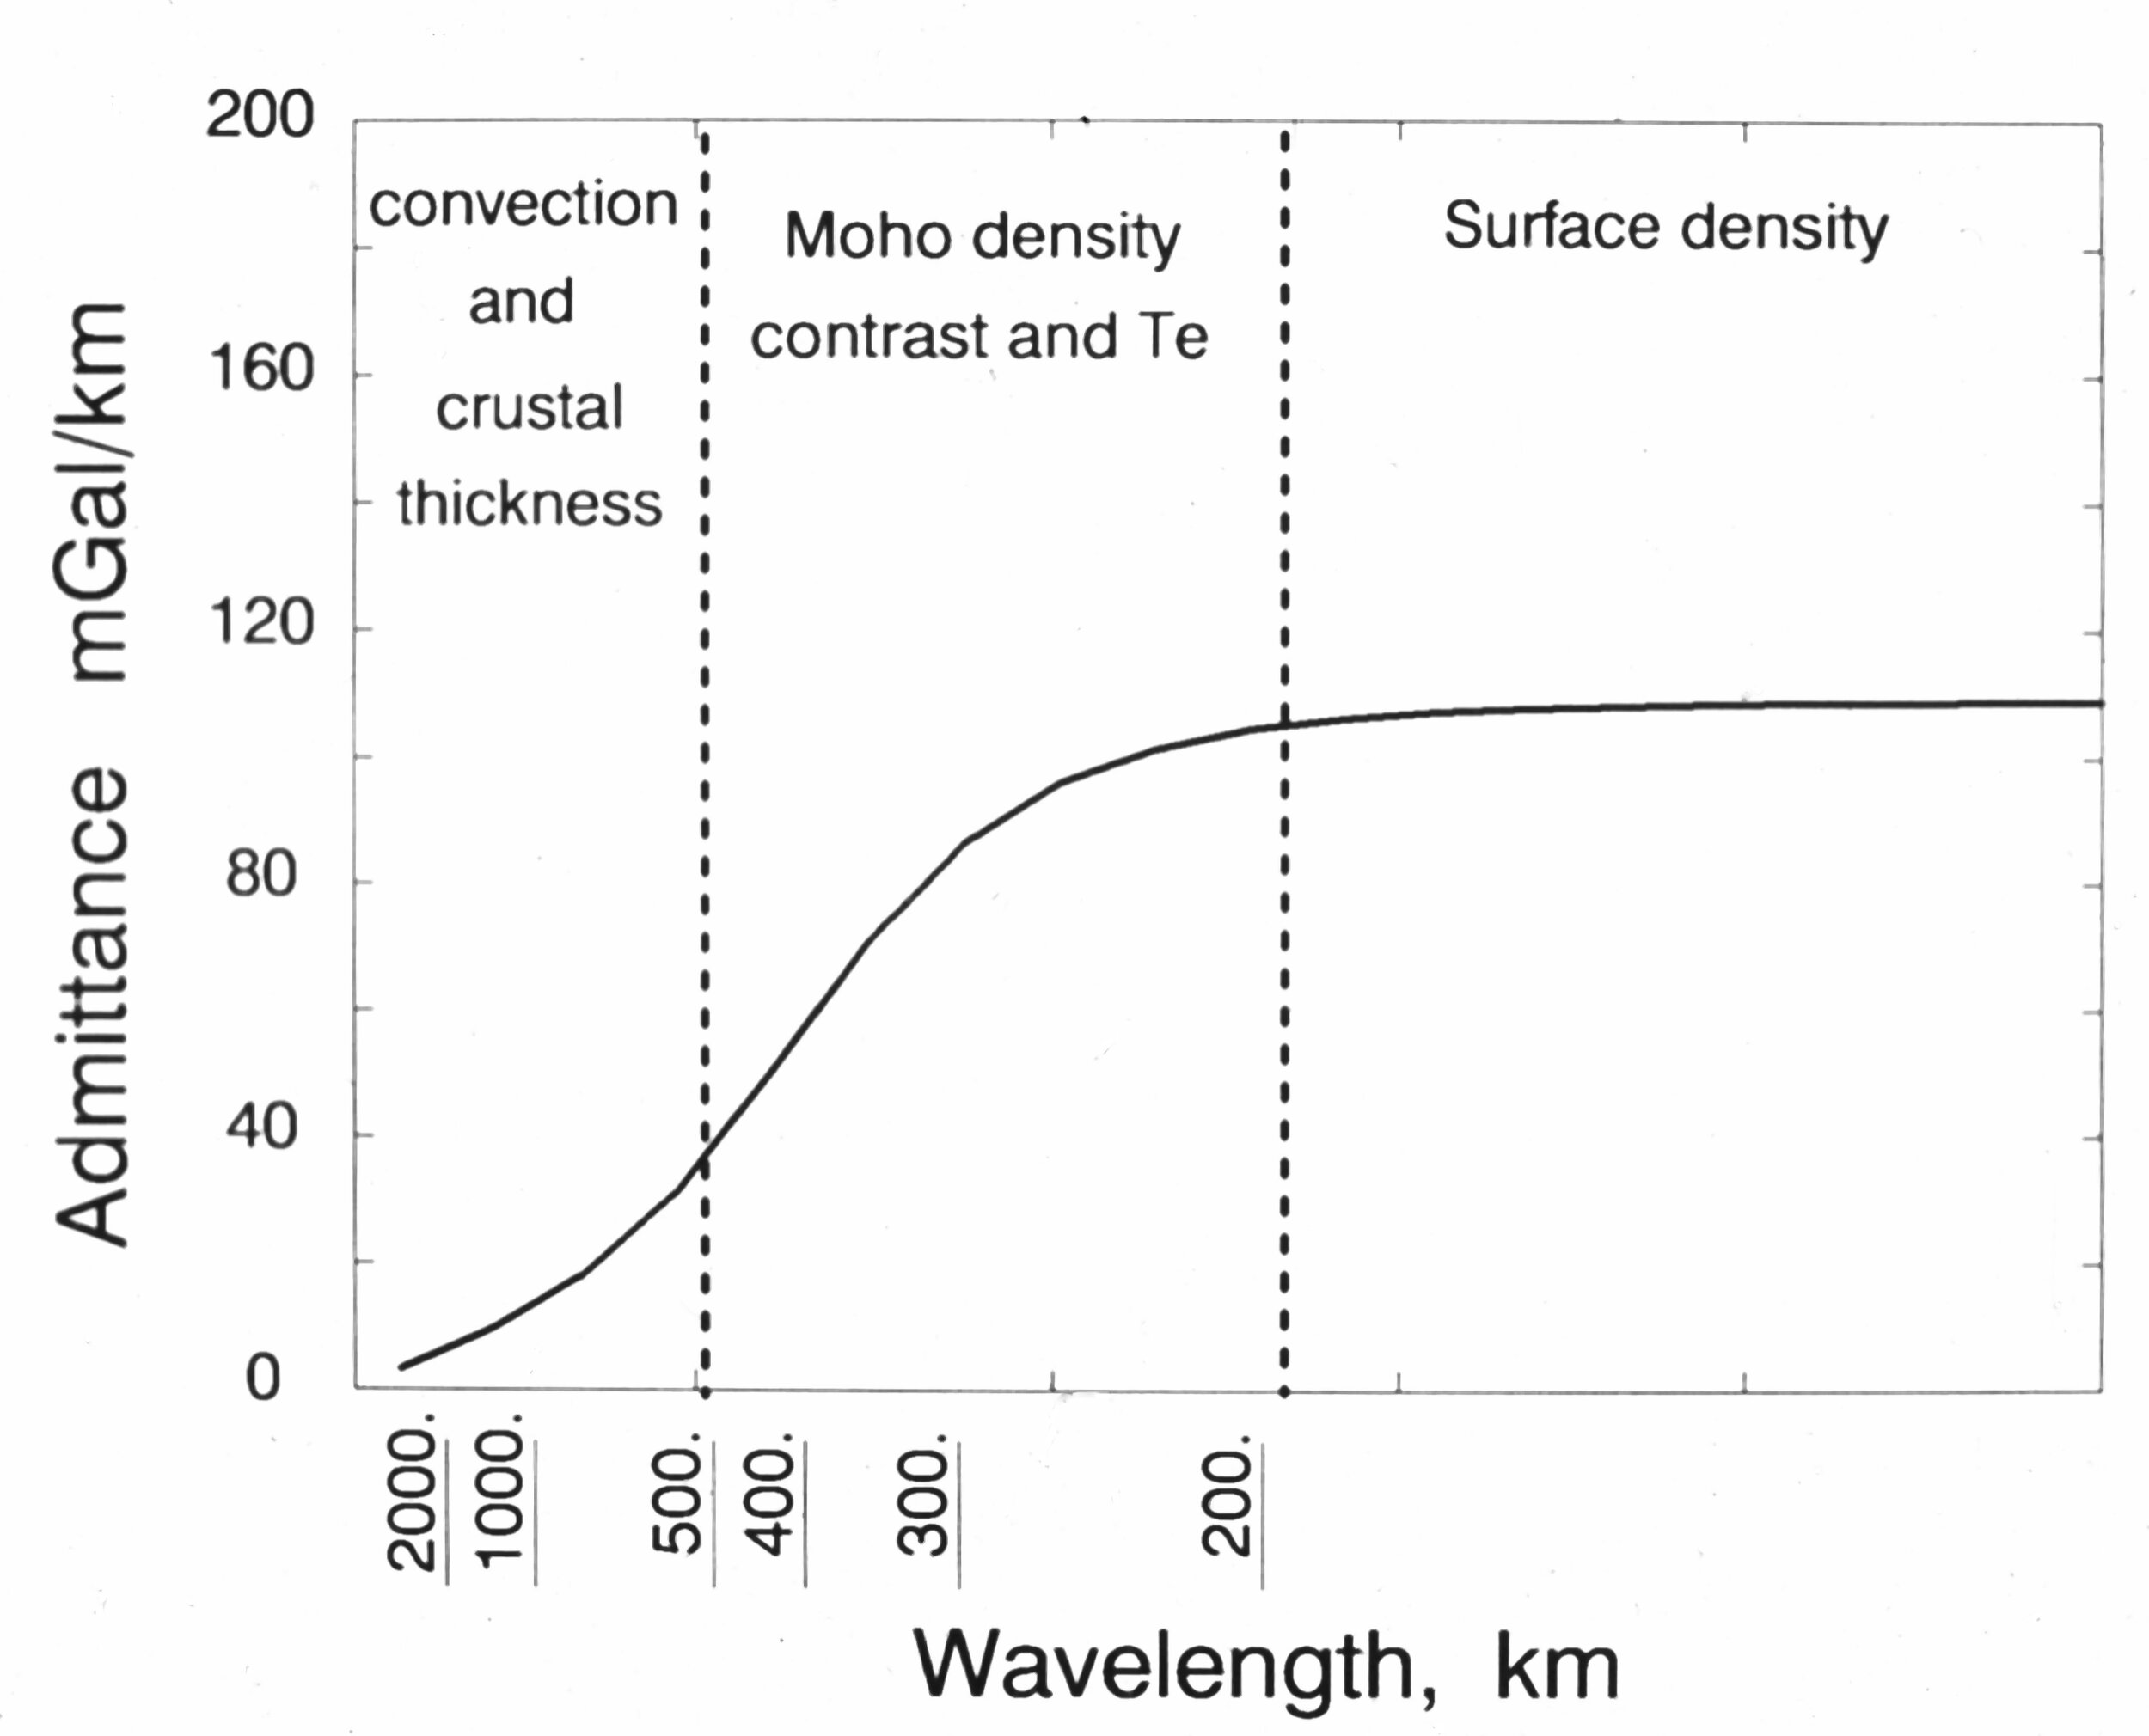
Graph showing how the relationship between the gravity field and elastically supported topography differs in each of three scale ranges. At large scales (i.e., long wavelengths) where convection and crustal thickness dominate, the expected relationship is shown on the left of the graph. The intermediate scales where elastic support dominates are shown in the middle of the diagram. At the small scales shown on the right of the figure, there is no compensation at all, and the curve flattens out, indicating that the gravity follows the topography.

Graphs showing the theoretical relationship between the ratio of gravity to elastically supported topography at different size scales for plates of different elastic thicknesses.

This is the graph that enabled Dan McKenzie to estimate the thickness of the elastic plate on Venus. It shows the scale above which elastic support is no longer important, i.e., where convection causes the observations (shown as circles) to depart from the curve expected for elastically supported topography, which occurs above about 700 km. The curve that best fits the observations in the elastically supported domain is that calculated for a 28 km thick plate.
All figures courtesy of Dan McKenzie