
David Kohlstedt on Simulating the Mantle in the Lab
Listen to the podcast here or wherever you get your podcasts.
Scroll down for podcast illustrations.

David Kohlstedt studies the behavior of samples containing olivine and other minerals under high pressures and temperatures in order to shed light on how they behave within the lithospheric and asthenospheric mantle. A capsule such as the one shown in the image below is inserted into the black cylindrical pressure vessel, which contains a heating element. High pressures in the sample are achieved using argon gas raised to high pressure using a series of pumps. Torque is applied to the sample via a piston that is loaded into the pressure vessel from the top. The rod seen extending out of the top of the vessel is the electrical supply connection rod for the torsion driver and external torque cell.
David Kohlstedt is Professor Emeritus at the School of Earth and Environmental Science at the University of Minnesota.
Courtesy of Rich Ryan
Podcast Illustrations
Experimental Apparatus

Sample assembly without the jacket enclosing the pistons and the sample. The sample is in the center, followed by alumina spacers (pistons), followed by alumina tapered pistons, followed by low-thermal-conductivity zirconia pistons.

Left: A sample of olivine and 4% mid-ocean ridge basalt (MORB) deformed in torsion to a full 360-degree rotation. An iron jacket encapsulates the sample and adjoining pistons. A crease in the jacket acts as a marker of the torsional strain, i.e., twisting, undergone by the sample. David Kohlstedt and his team chose to make the pistons out of alumina because they are stronger than the samples at high temperature (~1,300oC). Above 1,300oC, olivine reacts with alumina, so other materials such as molybdenum and thoriated tungsten are used. Right: Melt segregated into melt-rich bands containing ~25% melt leaving melt-poor regions with ~1% MORB behind. The melt-rich bands are inclined at ~15 degrees to the shear plane, antithetic to the shear direction.
Modified from King, D.S. et al. (2010), J. Petrol. 52:21-42, https://doi.org/10.1093/petrology/egp062

Exploded schematic view of a typical sample assembly for a torsion deformation experiment. The sample is inserted into a nickel sleeve and capped by alumina discs. Alumina and zirconia pistons complete the sample assembly, which is slipped into an iron jacket that seals against o-rings on the top and bottom steel pistons. The splines on the bottom steel piston slip into a cell for measuring torque inside the pressure vessel, while the dog teeth on the top steel piston mate with those in the torque driver/external torque cell. This complete sample assembly is loaded into the pressure vessel, which houses a wire-wound tubular furnace.
Courtesy of Mark Zimmerman

Backscattered scanning electron micrograph at the scale of individual mineral crystals showing the distribution of melt in an undeformed, partially molten rock composed of olivine plus basalt. Melt is present in all triple (three-grain) junctions and along some grain boundaries (two-grain junctions) but has no preferred orientation. The sample was formed by pressing a mixture of olivine and 5% basalt powders in a nickel capsule at a temperature of 1,200oC and a pressure of 300 MPa for 3 hours to form a coherent, fully dense sample. This is the starting material for a deformation experiment.
Kohlstedt, D.L. (2007), Properties of rocks and minerals – constitutive equations, rheological behavior, and viscosity of rocks, in Treatise on Geophysics, ed. G. Schubert, vol. 2.14, pp. 389-417
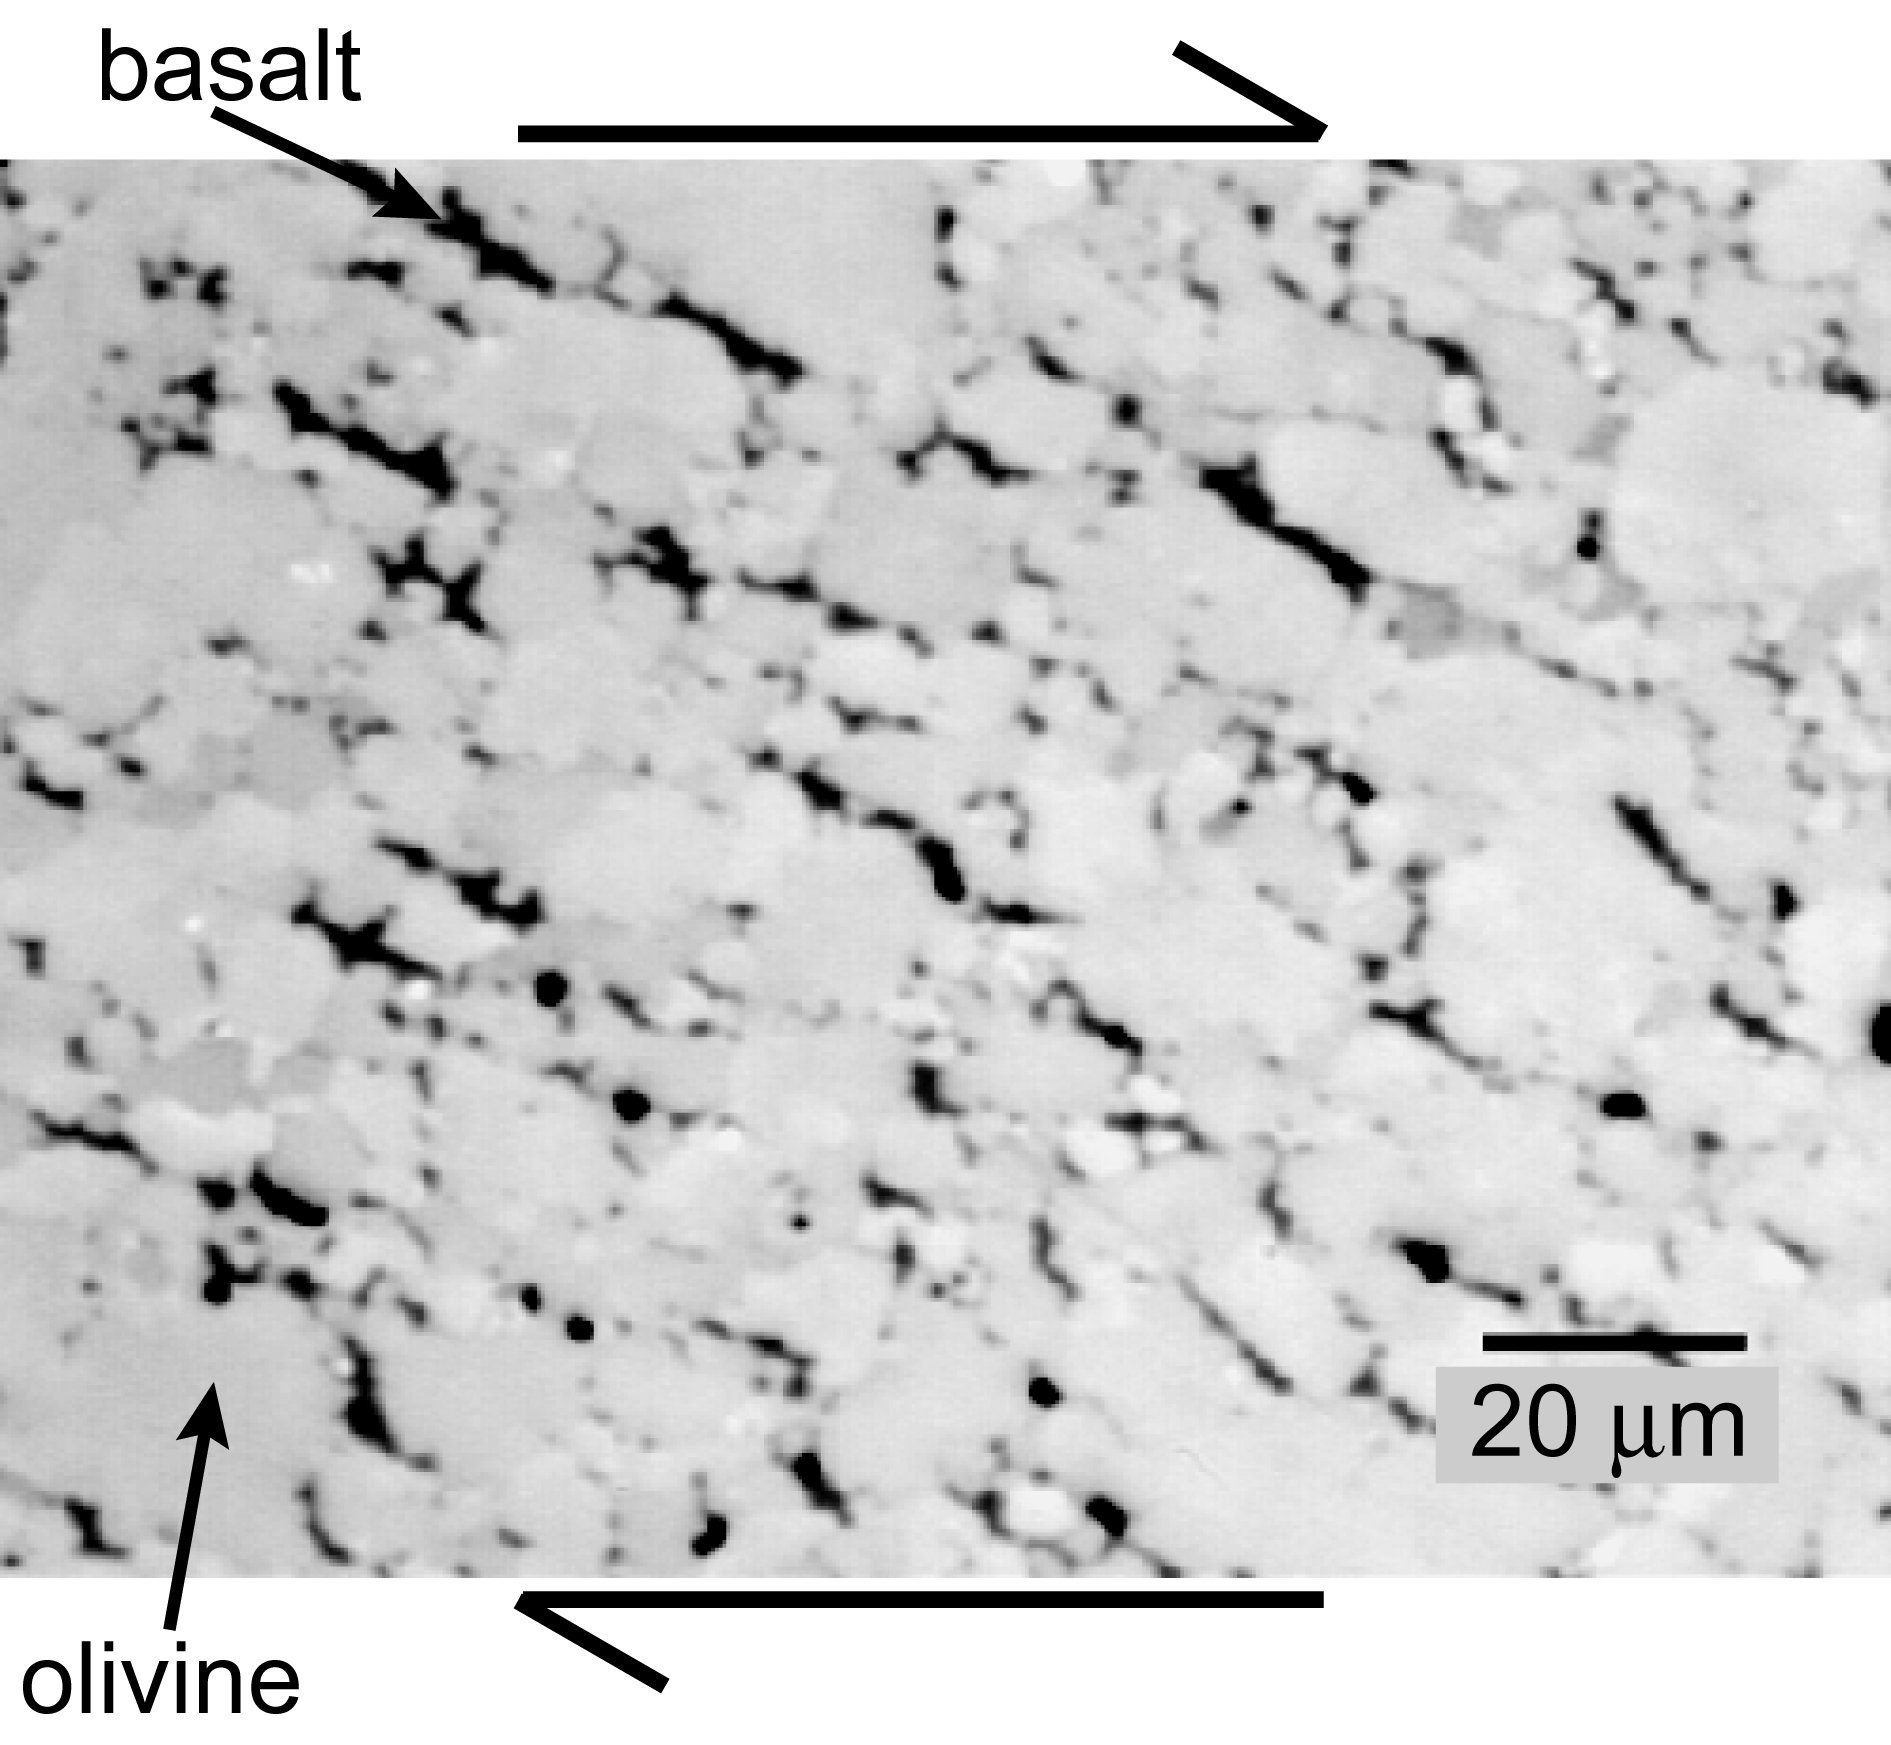
Reflected-light optical micrograph of a sample of olivine + 3% basalt deformed by a stress of 170 MPa to a shear strain greater than 2 at a temperature of 1,200oC and a pressure of 300 MPa. The image reveals a strong melt preferred orientation that developed at ~25 degrees to the shear plane and opposite to the shear direction. In this sample, the melt remained distributed on the grain scale and has not yet segregated into melt-rich bands. Olivine grains are light gray, and basalt is black.
Modified from Kohlstedt, D.L. (2002), Partial melting and deformation, in Plastic Deformation in Minerals and Rocks, eds. S.I. Karato, H.R. Wenk, Reviews in Mineralogy and Geochemistry, Mineralogical Society of America, vol. 51, pp. 105-125

Optical microscopy image of two orthogonal planes of a sheared sample. Images such as this one formed the basis of the sketches shown below. The sample contains melt-depleted lenses (outlined with dashes) that are generally longer in the direction normal to shear (y) than parallel to shear (x). This sample was deformed in simple shear rather than in torsion at T = 1250oC, P = 300 MPa at a shear stress of 116 MPa to a shear strain of 3.4. Melt-rich bands form under both types of loading conditions.
Holtzman, B.K. et al. (2007), J. Petrol. 48:2379-2406

Sketch of the distribution of melt and the way strain is partitioned in experimentally deformed samples of olivine plus basalt. (a) Melt-rich bands (yellow) form forking and rejoining networks with larger bands at higher angles relative to the shear plane (flat red arrow) connected by smaller bands at lower angles. In three dimensions, the melt-rich layers connect and surround melt-depleted lenses (green). (b) Partition of strain between forking bands and lenses between the bands. David Kohlstedt’s experiments were the first to observe such structures form. The flat arrows indicate the total shear and the component concentrated in the bands. The narrow black half-arrows indicate the alignment of the olivine crystals normal to the shear direction in the lenses. The black lines mark the orientation of the shear plane in the lenses, back-rotated relative to the sample shear plane as a result of the way the strain is partitioned between the melt-rich bands and the lenses.
Artwork by Benjamin K. Holtzman. Modified from Holtzman, B.K. et al. (2003), Science 301:1227-1230

Determining the Water Content of a Sample
As he explains in the podcast, David Kohlstedt ran experiments in which the amount of water present in a sample was varied by controlling the pressure at a fixed temperature so as to determine the dependence of rock strength on water content. In fact, it is the hydrogen ion H+ derived from the dissociation of water into H+ and OH- ions that weakens the minerals, not water. The hydrogen ions, being tiny, diffuse very rapidly from the water introduced into the sample assembly into the sample. Once inside the sample, the hydrogen combines with oxygen ions that are part of the olivine structure to form OH- ions. It is the infrared absorption spectrum of these OH- ions that are used to indicate the effective amount of water within the sample.
The figure shows infrared spectra taken from five olivine crystals, each heated to 1,100 degrees C while subjected to different pressures and thus subject to different water fugacities. Notice that the water fugacity (fH2O) changes by 7 orders of magnitude in response to a change in pressure of only about 2 orders of magnitude. The increase in water solubility/concentration is in response to the increase in water fugacity. The sharp peaks correspond to OH-stretching bands. The concentration of hydrogen is obtained by integrating the area under each absorption spectrum.
Hirschmann et al. (2012), Adapted from Kohlstedt, D.L. et al. (1996), Contrib. Mineral. Petrol. 123:345-357