
Water in the Mantle with Rita Parai
Listen to the podcast here or wherever you get your podcasts.
-
This transcript was generated automatically and lightly edited for readability.
Oliver Strimpel: This is Geology Bites with Oliver Strimpel.
The water we see on Earth's surface is only part of the planet's supply. The mantle beneath us holds water too, chemically bound inside the crystal lattice of minerals such as olivine. In an earlier episode, Geoff Abers discussed how much water subducting plates may have drawn down into the mantle, and how much was already there. But the mantle is not one uniform reservoir. Lavas erupted at mid-ocean ridges are thought to come from relatively shallow parts of the mantle, while the lavas erupting at places like Hawaii and Iceland are thought to be carried up by mantle plumes that tap the very deep mantle. As Sujoy Mukhopadhyay described in another episode, these two regions of the mantle have kept separate identities since the Earth's first hundred million years. So which part or parts of the mantle held water to begin with, and how has that changed over Earth's history?
The clues lie in the noble gases: helium, neon, argon, krypton, and xenon. These are chemically inert, and they travel passively with other volatiles, including water. Each noble gas also has several isotopes. Some date back to the Earth's formation, and their proportions help reveal where that early gas came from. Others are produced over time by the decay of radioactive elements such as uranium and thorium, and they record how much gas each part of the mantle has lost.
Rita Parai, Associate Professor of Earth, Environmental, and Planetary Sciences at Washington University in St. Louis, measures noble gases in mantle rocks and models how their isotopes evolved. Her results suggest that the source of mantle plumes started out dry, and that this may explain how it has survived for four and a half billion years.
Rita Parai, welcome to Geology Bites.
Rita Parai: Thanks so much for having me. I'm really excited to be here.
Oliver Strimpel: Why do we think that mid-ocean ridges sample the shallow mantle and hotspot plumes sample the deep mantle?
Rita Parai: So these are two different tectonic settings. At mid-ocean ridges, you have two tectonic plates that are spreading apart. When they spread apart, you have upwelling of that shallow mantle beneath, and that melt produces what we call mid-ocean ridge basalts. In contrast, at hotspots, you have magma generated by melting of a deep-rooted mantle plume. These are structures that we have seismically imaged as being rooted deep in the mantle. The tectonic plates just move over these mantle plumes, and the melting generated by anomalously hot mantle material in the plumes generates an island chain at the surface. Places like Hawaii, the Galápagos: these are hotspot volcanoes.
And so the observation was that the chemistry of the rocks produced at mid-ocean ridges was very different from the chemistry of rocks produced at these hotspot volcanoes. There were two sorts of categories of difference. One was that the variability that you see amongst different mid-ocean ridge basalts was much less than the variability that you see in hotspot basalts. And then the geochemical signatures that you're observing: some of them are early-formed signatures from radioactive decay, produced by radioactive isotopes that went extinct very early in Earth history. And so when you see those signatures surviving, and that heterogeneity showing up between the mid-ocean ridge basalts and the hotspot basalts today, it's telling you that these have been separate reservoirs for much of our history. And so, based on the seismology, the source of the hotspot volcanism is probably in the deep mantle, but the origins of the signatures are uncertain. And so we're trying to understand that.
Oliver Strimpel: So, as I mentioned, noble gases travel along with other volatiles. What exactly are volatiles, and how is it that we can use noble gases to trace their history?
Rita Parai: So in planetary science and geochemistry, we use "volatile" to refer to an element or a compound that's gaseous even at fairly low temperatures. And so water, carbon, nitrogen, and the noble gases are the volatile elements and compounds. When planetary scientists are studying habitability, they care a lot about the major volatiles: the water, the carbon, and the nitrogen. But the noble gases are passively tracing how those major volatiles move between the interior of the Earth and the surface of the Earth.
So those noble gases are powerful for a few reasons. First of all, they're inert, and so they're not participating in reaction chemistry. They're also present in really low abundances. And what that does is make it so that radioactive decay of other elements, like uranium or thorium, can change the isotopic composition of these very scarce noble gases by a lot, even if there's a relatively small amount of production.
So the way that I like to break this down for myself is that for every noble gas element, for helium, for neon, for argon, for instance, there's at least one isotope that's produced by nuclear reactions over time. Those are called radiogenic. And at least one isotope that's not produced over time. Those are called primordial isotopes, since they're not made inside the Earth; rather, they're inherited during Earth's accretion.
And so if you look at ratios of primordial isotopes, those are acting as fingerprints of where volatiles came from. So as the Earth accreted, you could have volatiles delivered from the solar nebula gas. You could have volatiles delivered by gas-rich rocky materials, like carbonaceous chondrites in our meteorite collection, or you could have volatiles delivered by comets. Each of those has a very different ratio of noble gas primordial isotopes.
The radiogenic isotopes: you can use ratios of the radiogenic to primordial isotopes to trace gas transport over time. So the decay of uranium, thorium, potassium, plutonium, and iodine, all of those are producing isotopes of noble gases.
Oliver Strimpel: Those radioactive parents that produce these radiogenic noble gas products decay at very different rates, and you make use of this to look at different stages of Earth history. Can you explain how that works?
Rita Parai: So the way that this works is that you have decay of your radioactive parent isotope, say iodine-129. That decays to produce xenon-129 with a half-life of about 16 million years. And so that system is extinct by about 90 million years after the start of the solar system. And so the iodine-xenon system is recording outgassing that occurs in the earliest part of Earth history. If you outgassed the Earth's mantle within that time frame, you would lose all the isotopes of xenon, and then you'd only be able to grow in new xenon-129 if iodine-129 was still alive. And so for the first 90 million years, you have production of xenon-129. For the first several hundred million years of Earth history, you can grow the plutonium fission products. And then uranium, thorium, and potassium, those are still extant today, so they're still producing noble gas isotopes today through their decay. And so these are tracing degassing throughout all of Earth history. And so you can get overlapping stories of how much outgassing occurred in the earliest part, in the first several hundred million years, and then throughout all of Earth history.
The other thing that's useful about the noble gases is that the atmospheric composition is distinct from the composition of the interior. And so you can also trace the opposite flux, of atmospheric gas into the mantle, if you measure the full suite of noble gases.
Oliver Strimpel: Just to be clear about the terminology, when you say outgassing or degassing, you mean gas leaving the mantle and going out into the atmosphere, I guess.
Rita Parai: Yes, that's what I mean.
Oliver Strimpel: Just to ask the very basic question, what does the ratio of the primordial to radiogenic isotopes of a particular noble gas actually tell you?
Rita Parai: So the ratio of radiogenic and primordial isotopes is telling you about the amount of gas that's been lost from the reservoir. So the extent to which it's lost gas will affect how much the production of the radiogenic isotope stands out. And so if you have a reservoir that has experienced very little outgassing, it's retained more of its initial gas budget, and so that production by radioactive decay is relatively muted. Whereas if you have a reservoir that has experienced lots of outgassing, the production by radioactive decay of these non-volatile parent isotopes, that's going to stand out and show itself as a very high ratio of radiogenic to primordial isotopes.
Oliver Strimpel: So, as you say, the radioactive parent isn't volatile and stays locked up in the minerals when the mantle loses its gas. And so it goes on making the radiogenic isotope?
Rita Parai: Yes. So you would lose the element that is the radiogenic daughter and keep the element that is the radioactive parent. And so over time, that translates to a high ratio of the radiogenic daughter isotope to the primordial isotope of that daughter element.
And so the example that I like to talk through is with helium. You could have a mantle reservoir with a certain amount of uranium and thorium, and a certain amount of helium-3 and helium-4 to start off with. Now, over time, if you have no outgassing, some of that uranium and thorium decays and produces helium-4, and you would end up with a certain mixture of helium-3 and helium-4 at the end of four and a half billion years. And that would be your closed, undegassed reservoir, a primordial reservoir. Now, if you had the same starting composition and you had lots of outgassing from that mantle reservoir, you would lose both the helium-3 and -4 during the outgassing, but you would only grow the helium-4 over time. And so your ratio of the 3 to 4 would be low, and the ratio of radiogenic to primordial would be high.
Oliver Strimpel: How do the different noble gases tell you about how much gas each of the different reservoirs of the mantle have lost?
Rita Parai: Yes, so when we look at mid-ocean ridge basalts and compare their noble gas compositions to these plume basalts, if we're applying that framework of more outgassing leads to a high ratio of radiogenic to primordial isotopes, we can look at helium, neon, and argon and find that they all have a lower ratio of radiogenic to primordial isotopes in the plume samples compared to the mid-ocean ridge basalts. And so that indicates that the source of plume volcanism, the mantle source that's being tapped by that volcanism, has retained more of its gas and been processed less by melting over its history. So the conventional read on that is that the plume source is a primitive reservoir that's been less processed by convection and plate tectonics than the upper mantle, and that it's retained more of its initial gas budget.
Oliver Strimpel: You mentioned that the primordial source of these noble gases, and their ratio among the different isotopes, depends upon which of the three different building blocks, if you like, contributed to that reservoir. So can we use that to tell where each part of the mantle actually got its volatiles in the first place?
Rita Parai: Yes. It's a tricky problem because, as you say, there are three different, or at least three different, contributors. The solar nebular gas could be one; your volatile-rich rocky materials, that could be similar to carbonaceous chondrites in our meteorite collection; you could have a contribution from comets. Each one of those could have contributed, and multiple, mixed together, could contribute during accretion. The strength, or the power, of the noble gas isotope systems is that these candidate contributors each have very different fingerprints in terms of their primordial noble gases. And so you can use those primordial isotope ratios, like the ratio of neon-20 to -22, to investigate where Earth's volatiles came from.
And so if you look at the ratio of neon-20 to -22 in solar nebular gas, it has a high ratio, about 13.4. Your volatile-rich rocky materials, those have a low ratio, around 8. And then the comets are in between, about 11. And so that would be one axis of information, and then you could build out other axes from there. You could look at the ratio of a primordial isotope of xenon to a primordial isotope of neon, and you would see these distinct patterns, these distinct fingerprints, where, for instance, the solar nebular gas is very rich in helium and neon and poor in xenon. And the opposite is true of the volatile-rich rocky material: you have a very high ratio of xenon to the light noble gases in those. And so by using those differences, and leveraging those differences, you can try to compute what the starting mixtures were for the upper mantle versus the plume mantle.
Oliver Strimpel: What did you find out?
Rita Parai: What I found out was that when you compute these mixtures, the upper mantle requires a higher contribution from the volatile-rich rocky materials than the plume mantle does. And so just from the primordial isotope signatures, you would have a mixture of solar and this volatile-rich rocky material in both, but the proportion of the volatile-rich rocky material would be higher in the upper mantle.
Oliver Strimpel: And does that kind of tally with our ideas about planetary formation?
Rita Parai: In my mind, yes. I think that is something that could fit into the framework of the late veneer, late-accreted material that's added after the last giant impact. If that is material that is mixed into the upper mantle preferentially, that could be explaining a higher contribution to the upper mantle today.
Oliver Strimpel: The plume source is often described as more primitive, as you mentioned, because it's lost less of its gas. Does that also mean that it's actually rich in gas overall?
Rita Parai: Not necessarily, and that's a critical distinction. There's a difference between keeping a large fraction of what you started with and being gas-rich in an absolute sense. So that depends on how much gas you started with. And so this is something that I modeled. Using my modeled mixtures of what the initial gas isotope compositions were, so a certain mix of solar and volatile-rich rocky accreted materials, I then used models of reservoir outgassing, radioactive decay and the associated radiogenic ingrowth, and then atmospheric influx over four and a half billion years. And I was applying a forward model to explore a wide parameter space: how much outgassing did you have, what was the initial gas concentration, trying out different combinations, and trying to see how I could match today's helium, neon, and xenon isotope ratios simultaneously. So could I start at point A and get to the modern mid-ocean ridge basalt composition in helium, neon, and xenon simultaneously? And if so, what model parameters gave me the best fit?
And so when you do that, what you find is that that initial framework, of the plume source experiencing less outgassing than the upper mantle, that still stays. But by itself it is not sufficient. You also need for there to have been a difference in the initial gas concentration, with the plume mantle, surprisingly, being gas-poor compared to the upper mantle. And so the story that comes out of that modeling effort is that you started with different mixtures, with different initial concentrations, and then evolved in a way where you had more outgassing of the upper mantle and less outgassing of the plume mantle, but a very different nature for both of them initially.
Oliver Strimpel: And so the lower mantle would have started out with less gas, less xenon in particular. And because water travels along with the noble gases, or vice versa, does that also have implications for how much water started out in this plume source?
Rita Parai: It could. So in the materials that accreted to build the Earth, water and xenon are associated with each other. The minerals that carry water, that have water incorporated into the mineral structure, these also hold xenon. And so a low accreted xenon concentration would translate to a low accreted water content. At the end of accretion, my calculation was that the plume source would have had at least four times less water, up to 250 times less water, than the upper mantle at the end of accretion.
Oliver Strimpel: So it started out with less water. Is that consistent with what you just mentioned earlier about using the ratio of the primordial isotopes to figure out what was the constituent component of the deep mantle versus the shallow mantle?
Rita Parai: It is. It's consistent, and those are two independent results.
Oliver Strimpel: I know that the viscosity of the mantle is heavily dependent on its water content, with dry mantle having a very much higher viscosity than wet mantle. So if the lower mantle started out dry, or drier, as you suggest, what could we infer more broadly about the evolution of the mantle?
Rita Parai: So having a factor of 10 difference in water content, that could lead to a huge difference in the viscosity of the mantle. So a dry ancient plume mantle would be a dry, stiff ancient plume mantle, and that would be a reservoir that could resist mixing. It would not easily be entrained in convective circulation. I suggest that three things could result from that: that you could have a potential explanation for why giant impacts didn't homogenize the growing Earth; it could be why the plume source is less processed; and why these early-formed heterogeneities survive, like the xenon-129 heterogeneity. There's a heterogeneity in early-formed tungsten-182. This is a possibility; there could be other reasons.
Oliver Strimpel: But today, plume sources seem to hold more water than the upper mantle sources. How do you square that with having started out dry, or drier?
Rita Parai: Yes, it places a very interesting requirement on the nature of the water in the plume source today. The amount of water in the plume source today, we think it's about 400 to 1,000 parts per million H2O in the plume mantle, and that's wetter than the modern mid-ocean ridge basalt source. That's about 50 to 200 parts per million water. So that's at least double, and up to 20 times more water in the modern plume mantle compared to the upper mantle. That's a reversal of the initial contrast, where the plume source was dry. So the implication is that most of the plume source's water is not primordial.
So there would be two physical possibilities. Slabs could be carrying water into the plume source: so subducted plates that are bearing hydrous minerals bearing xenon. If some of that water, some of that xenon, is held within the subducting slab beyond depths of magma generation, that could carry those volatiles deep into the Earth's interior, where they would mix into the plume source. That's one possibility. Another possibility is that when plumes are rising, they could entrain water-rich material from, say, the transition zone on their way up to the surface.
Oliver Strimpel: In his podcast on Geology Bites, Geoff Abers described how subducting plates can carry water back into the mantle, with the cold subducting slabs taking it to the deepest levels. Can your work help us disentangle whether indeed that was the process that took the water down there, or whether the plumes are actually just grabbing their water on the way up?
Rita Parai: Yes. For there to be deeper cycling of water, and that carrying of atmosphere-derived xenon along with water into the mantle, we can put some constraints on when that started to be a process that was occurring on Earth. There's this really interesting story about how xenon in the atmosphere has evolved over time. I study noble gases in the mantle, and so I have colleagues who have studied atmospheric noble gases, including xenon, and they've built over the past 15 years this record of paleo-atmospheric xenon that was showing that the xenon isotopic composition of the atmosphere evolved for the first two billion years of Earth history or so. A very interesting story of possible photochemistry in the atmosphere that was shut down during the Great Oxygenation Event.
For us, on the mantle side, that was of interest because it provided a fingerprint for old atmosphere. And so if you carried atmospheric xenon into the mantle three billion years ago, it would have had a distinctive composition, different from what it would have looked like 2.7 billion years ago, different from what it would have looked like 2.4 billion years ago. And so with that same forward modeling approach, we looked at different possible histories of atmospheric influx into the mantle, and we found that prior to around two and a half billion years ago, you really could not tolerate much atmospheric influx into the mantle, because you would have been bringing this strange isotopic composition into the mantle, and it would be difficult to get rid of it, and it's not observed today. And so from that we inferred that this cold style of subduction, where the subduction zone is cold enough for volatiles to be retained partially within the slab as that slab goes beyond the depth of magma generation, that is recent in terms of Earth history. Sometime in the past two and a half billion years, you started to have retention of volatiles in those subducting slabs.
Oliver Strimpel: So by recent, you mean not before two and a half billion years ago?
Rita Parai: Yes. Not recent in anyone's normal sense of the word, but that's right.
Oliver Strimpel: Does any of this have any implications for when plate tectonics might have started?
Rita Parai: So the part of the modeling that had to do with the carrying of surface water and xenon in subducting slabs through a subduction zone and to the deep mantle, that's providing a constraint on when the subduction zones became cold enough to retain volatiles within the subducting slab. Plate tectonics could have started earlier than that. There's plenty of evidence for plate tectonics three billion years ago. It's been suggested all the way up to more than four billion years ago. And so the xenon isotopic compositions of the mantle can't really tell you about the onset of plate tectonics generally, just about when plate tectonics could have started carrying xenon into the mantle. That's what the system sees.
Oliver Strimpel: What are some of the big open questions in the field, and what would help settle them?
Rita Parai: What I would love to know is what some intermediate compositions, or snapshots, of the mantle compositions were like over time. I start with a guess of what the initial composition was, and I'm modeling my way towards observational constraints on the modern compositions. And so having some stations along the way that need to be hit would give us a lot of insight into which histories of volcanic outgassing, which histories of atmospheric influx with subduction, could have been occurring. I think it would be exciting to build a paleo-mantle archive, the way this paleo-atmospheric xenon archive has been built.
Oliver Strimpel: Do you have any thoughts about how you might get some of those middle points between the beginning and the end point, if you like?
Rita Parai: A few things, I think, are necessary. First, if you want to understand what the mantle composition was like in the deep past, say more than 200 million years ago, we have to look at crustal rocks. We can't look at very, very old mid-ocean ridge basalts, for instance, because the oldest oceanic crust is only about 200 million years old. And so we have to start to understand what processes affect the gas contents of rocks that are preserved in the continental crust. And the continental crust is a much more complex system. You have ancient fluids that have just been percolating within the crust, collecting radiogenic isotopes. You may have paleo-atmospheric fluids that are trapped and have a certain lifetime of circulating through these systems. And then, possibly, if we're lucky, there could be magmatic gases from very ancient melt production trapped within bits of the continental crust.
Oliver Strimpel: In other words, analyzing the right kinds of rocks that might have the fingerprints from those intermediate periods, maybe spanning three billion, two billion, one billion years ago.
Rita Parai: Yes, exactly.
Oliver Strimpel: Coming back to the question which I posed right at the very beginning, does this cast light on how much of the mantle's water has been there from the very beginning, and how much was carried down into it later?
Rita Parai: Yes. We have different answers for the two reservoirs, which I find really interesting. The upper mantle, I think, started relatively wet, and then over Earth history lost most of its original gas through melting and outgassing. And now the upper mantle is striking this balance between outgassing and atmospheric influx, but keeping kind of an even concentration for the last, say, 500 million years. In contrast, the plume source started dry, and much of its present-day water budget is derived from the surface and was recycled through subduction of slabs, or entrained as plumes rose through the transition zone. So you'd start off with a drier, stiffer lower mantle, and then over time reverse that sense, possibly make the upper mantle drier and stiffer compared to the lower mantle.
Oliver Strimpel: Rita Parai, thank you very much.
Rita Parai: Thanks so much for having me.
Oliver Strimpel: To see pictures and illustrations that support this podcast, and to read a transcript of each episode, go to geologybites.com, where you'll also find a subject index of all the episodes. There you can also give me feedback, which I welcome, and sign up to get my emails about new episodes. Please follow Geology Bites wherever you listen. The podcast carries no advertising, so it grows best by word of mouth. If you know someone who'd enjoy this episode, please pass it on.
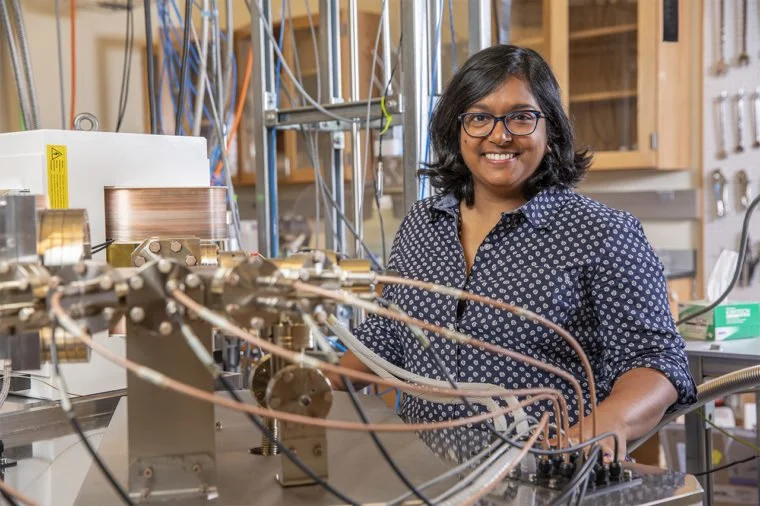
The oceans are not the Earth’s only store of water: the mantle holds water too, bound into its minerals. But the mantle is not one uniform reservoir. Lavas erupted at mid-ocean ridges come from the shallow mantle, while plumes beneath places like Hawaii and Iceland tap a deep region that has kept a separate identity since the Earth's first hundred million years. Which part held water to begin with, and how has that changed? The noble gases hold clues, because they travel with water, and their isotopes record both where volatiles came from and how much gas each part of the mantle has lost. In the podcast, Rita Parai explains how she reads those records, and why they suggest that the deep source of plumes started out dry, perhaps stiff enough to resist being stirred into the rest of the mantle, and got much of the water it holds today from the surface. She is Associate Professor of Earth, Environmental, and Planetary Sciences at Washington University in St. Louis.
Photo: Joe Angeles, Washington University in St. Louis
Two Parts of the Mantle
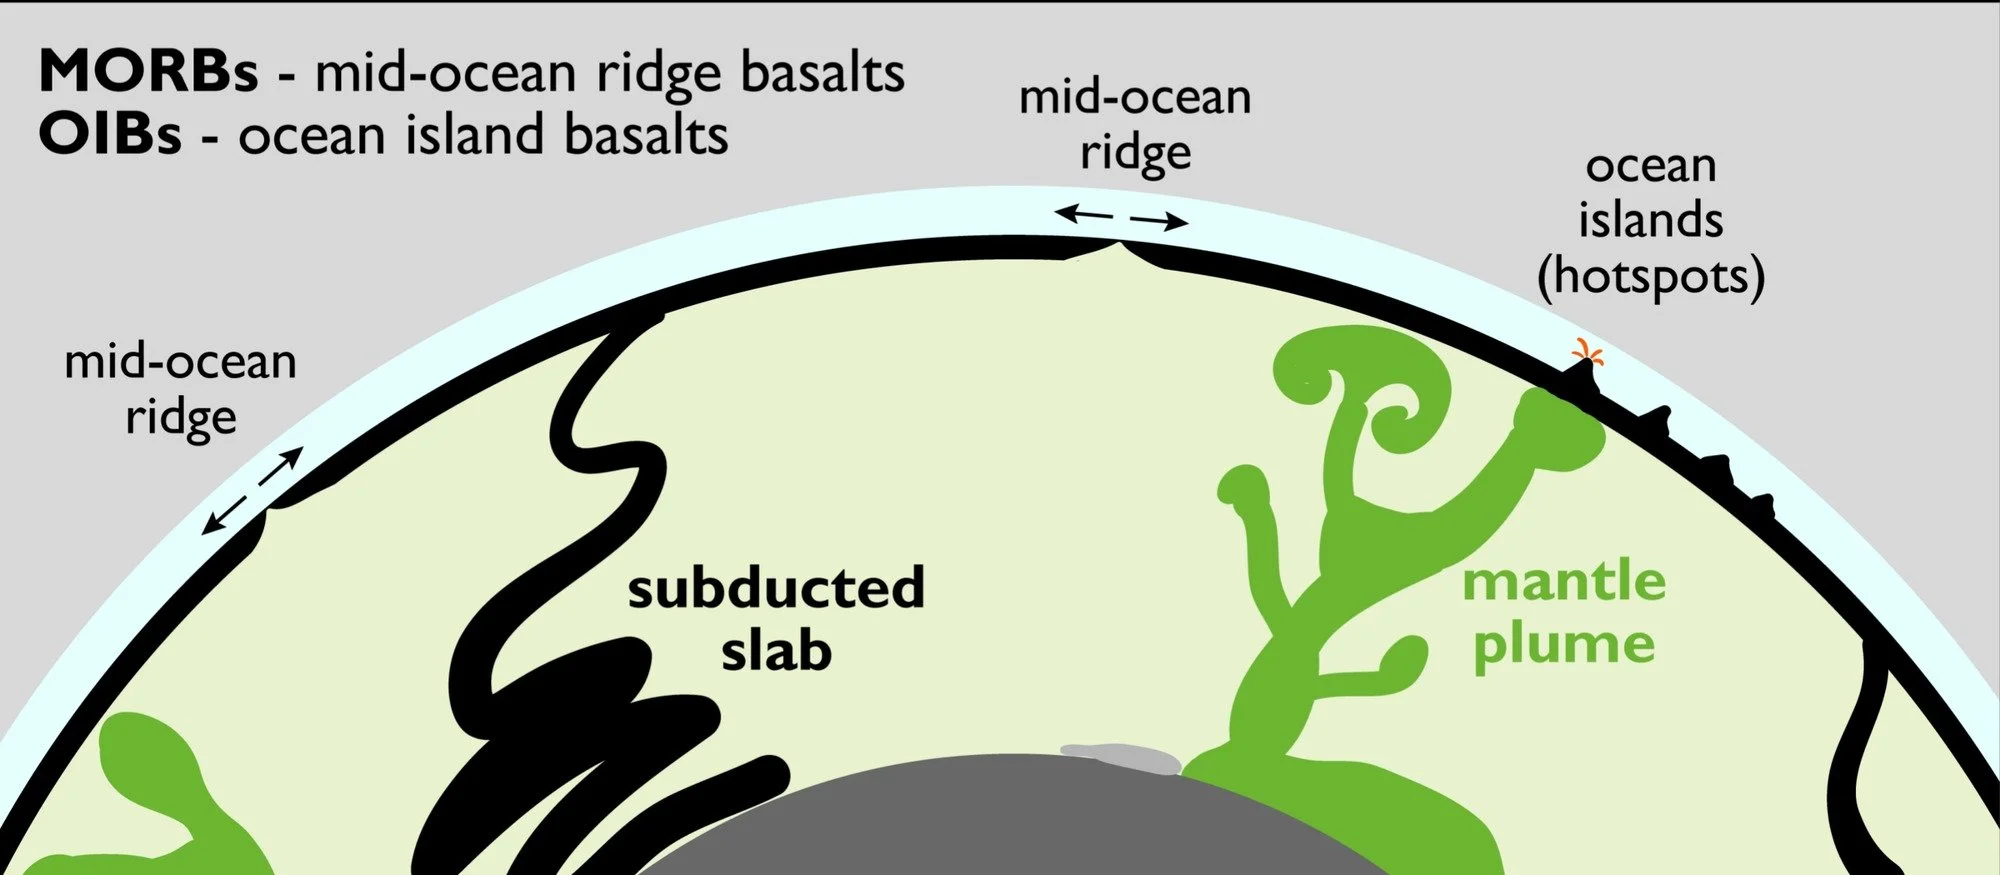
Basalts erupted at mid-ocean ridges (MORBs) and at ocean islands (OIBs) come from different parts of the mantle. At ridges, plates pull apart and shallow mantle rises to fill the gap and melts. Ocean islands such as Hawaii and the Galápagos sit above mantle plumes, which seismic images show rooted deep in the mantle. In the podcast, Rita Parai explains that ridge basalts are far more uniform in composition than ocean island basalts, and that some of the signatures that tell them apart formed very early in Earth's history, so their sources have stayed apart ever since. The subducted slab (left) is a reminder that plates carry surface material, including water, back into the mantle.
Courtesy of Rita Parai
Noble Gases as Tracers
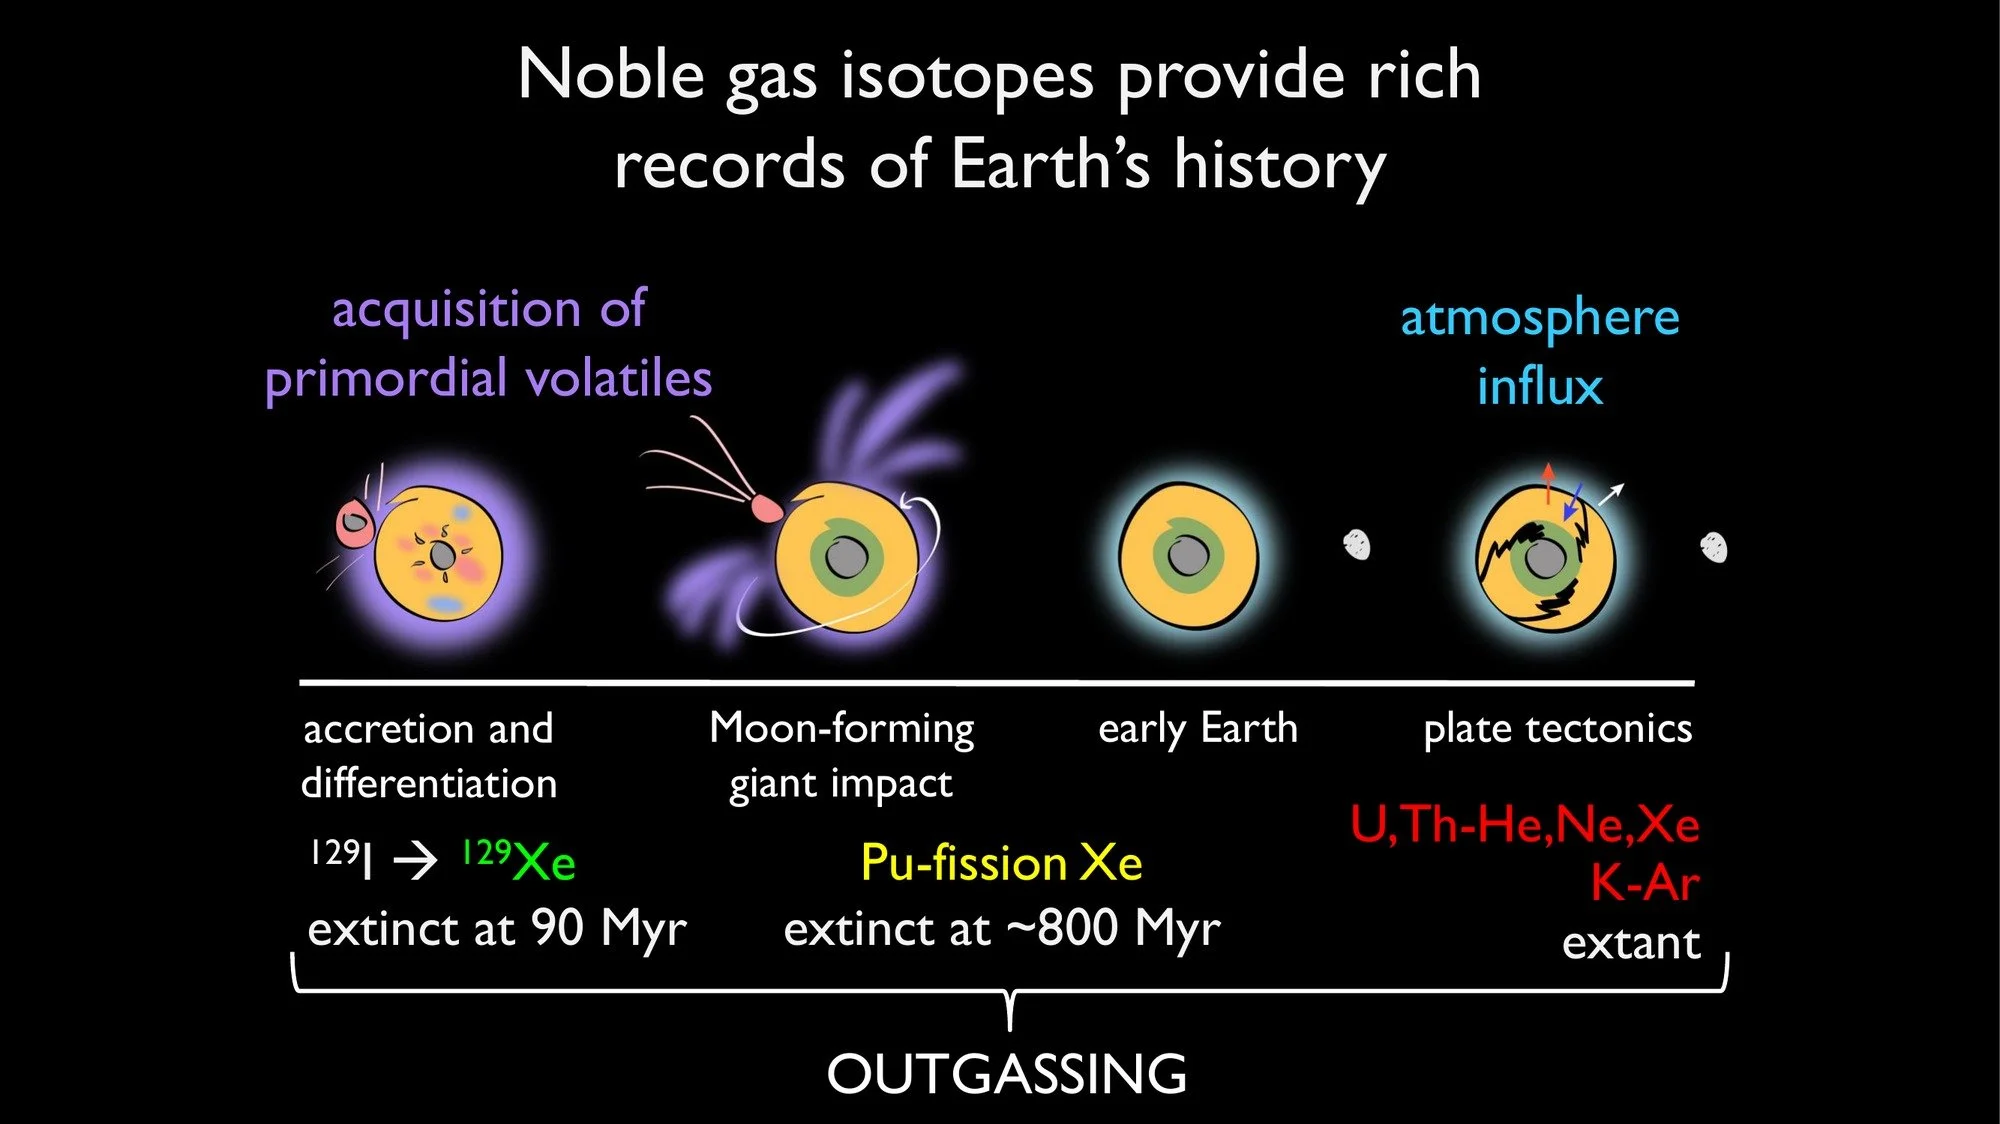
Noble gases record different stages of Earth's history, because their radioactive parents decay at very different rates. Iodine-129 decays to xenon-129 with a half-life of about 16 million years, so it was extinct within about 90 million years and records outgassing only in that earliest period. Plutonium-244 produced fission xenon until about 800 million years. Uranium and thorium, which produce helium, neon and xenon, and potassium, which produces argon, are still decaying today, so they record outgassing throughout Earth's history. Because the atmosphere's noble gases have a distinctive composition, air carried back into the mantle (atmosphere influx) can be traced too. The sketches show the stages, from the Earth's accretion and the Moon-forming giant impact to plate tectonics.
Courtesy of Rita Parai
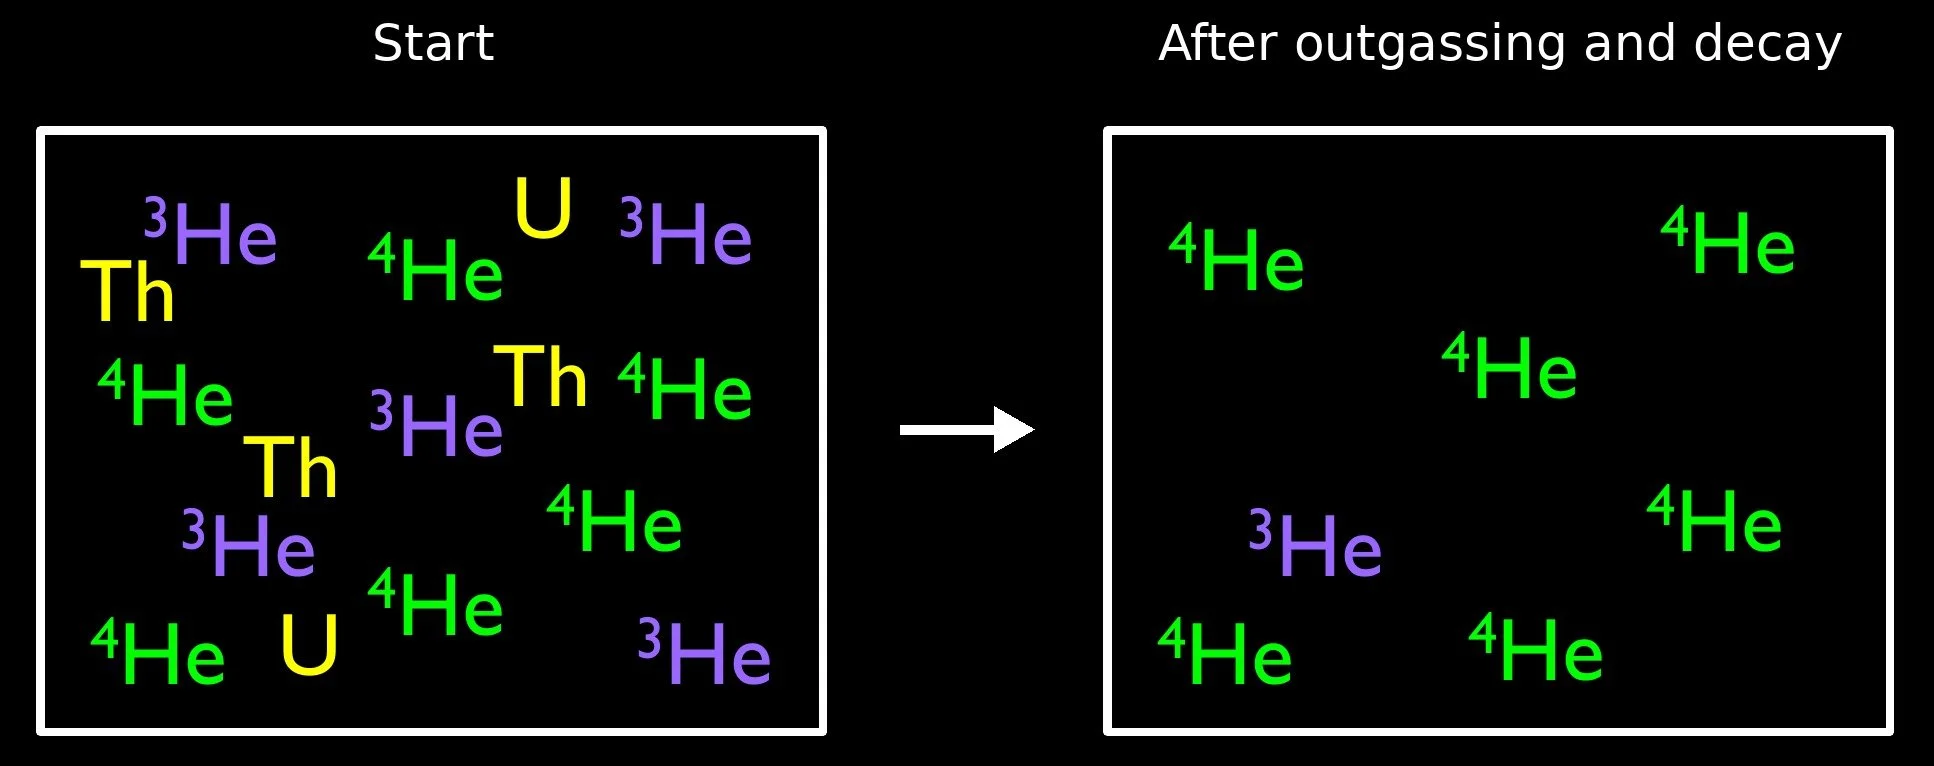
Why outgassing raises the ratio of radiogenic (green) to primordial isotopes (purple), with helium as the example. A mantle reservoir starts with some primordial helium-3 and some helium-4, along with uranium (U) and thorium (Th), which decay to make more helium-4 (left). When the reservoir outgasses, it loses both helium isotopes, but uranium and thorium are not volatile and stay behind. So afterward only helium-4 builds up again, and the ratio of helium-4 to helium-3 ends up high (right). In the podcast, Rita Parai explains that a reservoir that has lost little gas keeps a ratio closer to where it started.
Courtesy of Rita Parai
Which Part of the Mantle Has Lost More Gas?
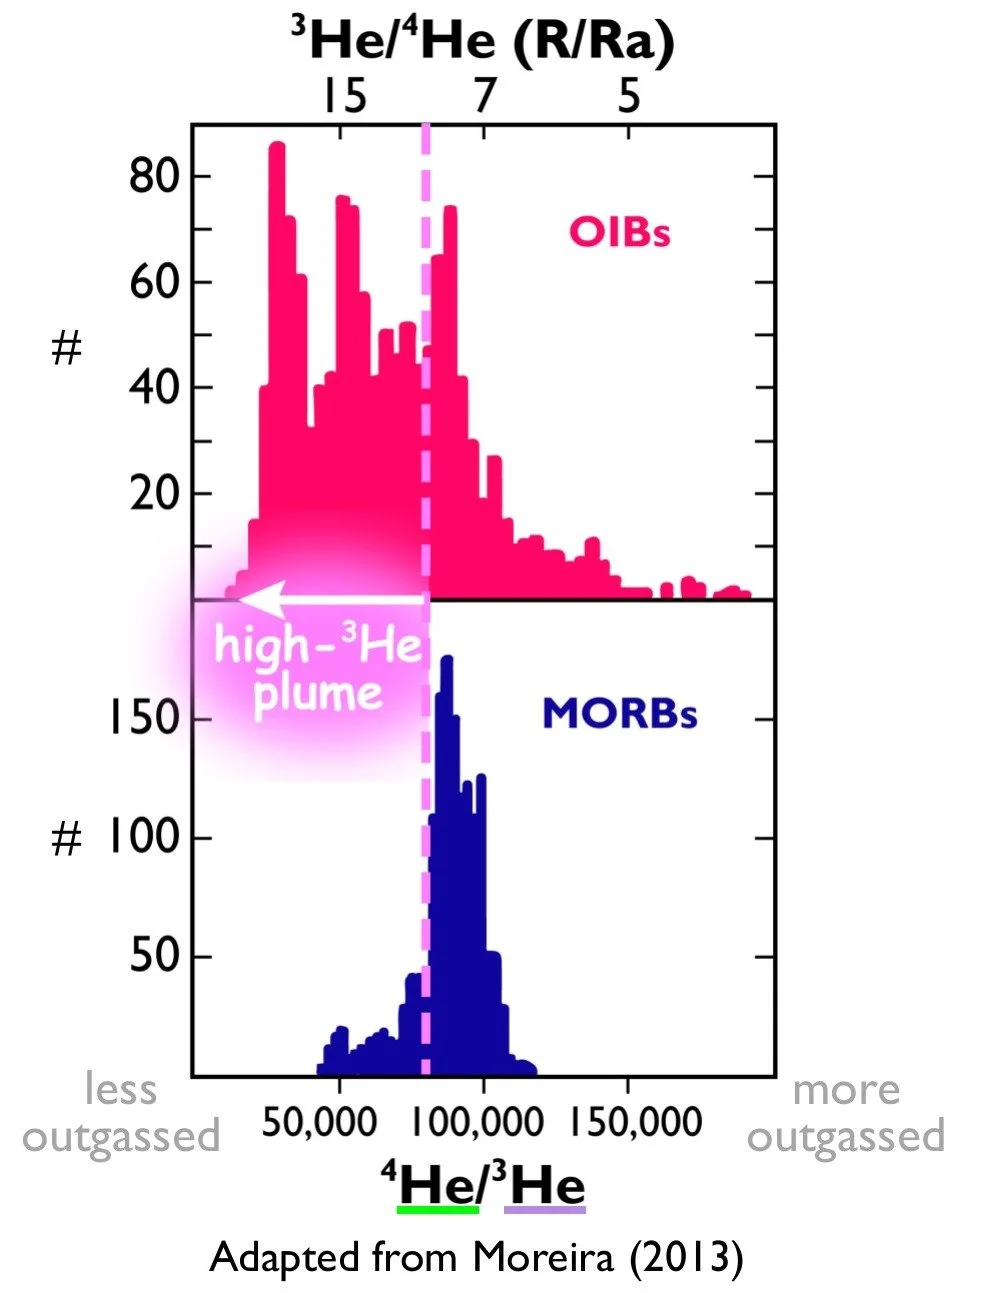
Helium isotopes in basalts from ocean islands (OIBs, top) and mid-ocean ridges (MORBs, bottom). Ridge basalts cluster tightly, at a ratio of helium-4 to helium-3 of about 90,000. Many ocean island basalts have much lower ratios, with more primordial helium-3 relative to radiogenic helium-4: the mark of a source that has lost less gas. Geochemists have long taken a high helium-3 signal, more than about 7 to 9 times the ratio in air (Ra, top axis), as the sign that a lava has tapped a plume.
Courtesy of Rita Parai; adapted from Moreira, M. (2013), Geochemical Perspectives 2:229
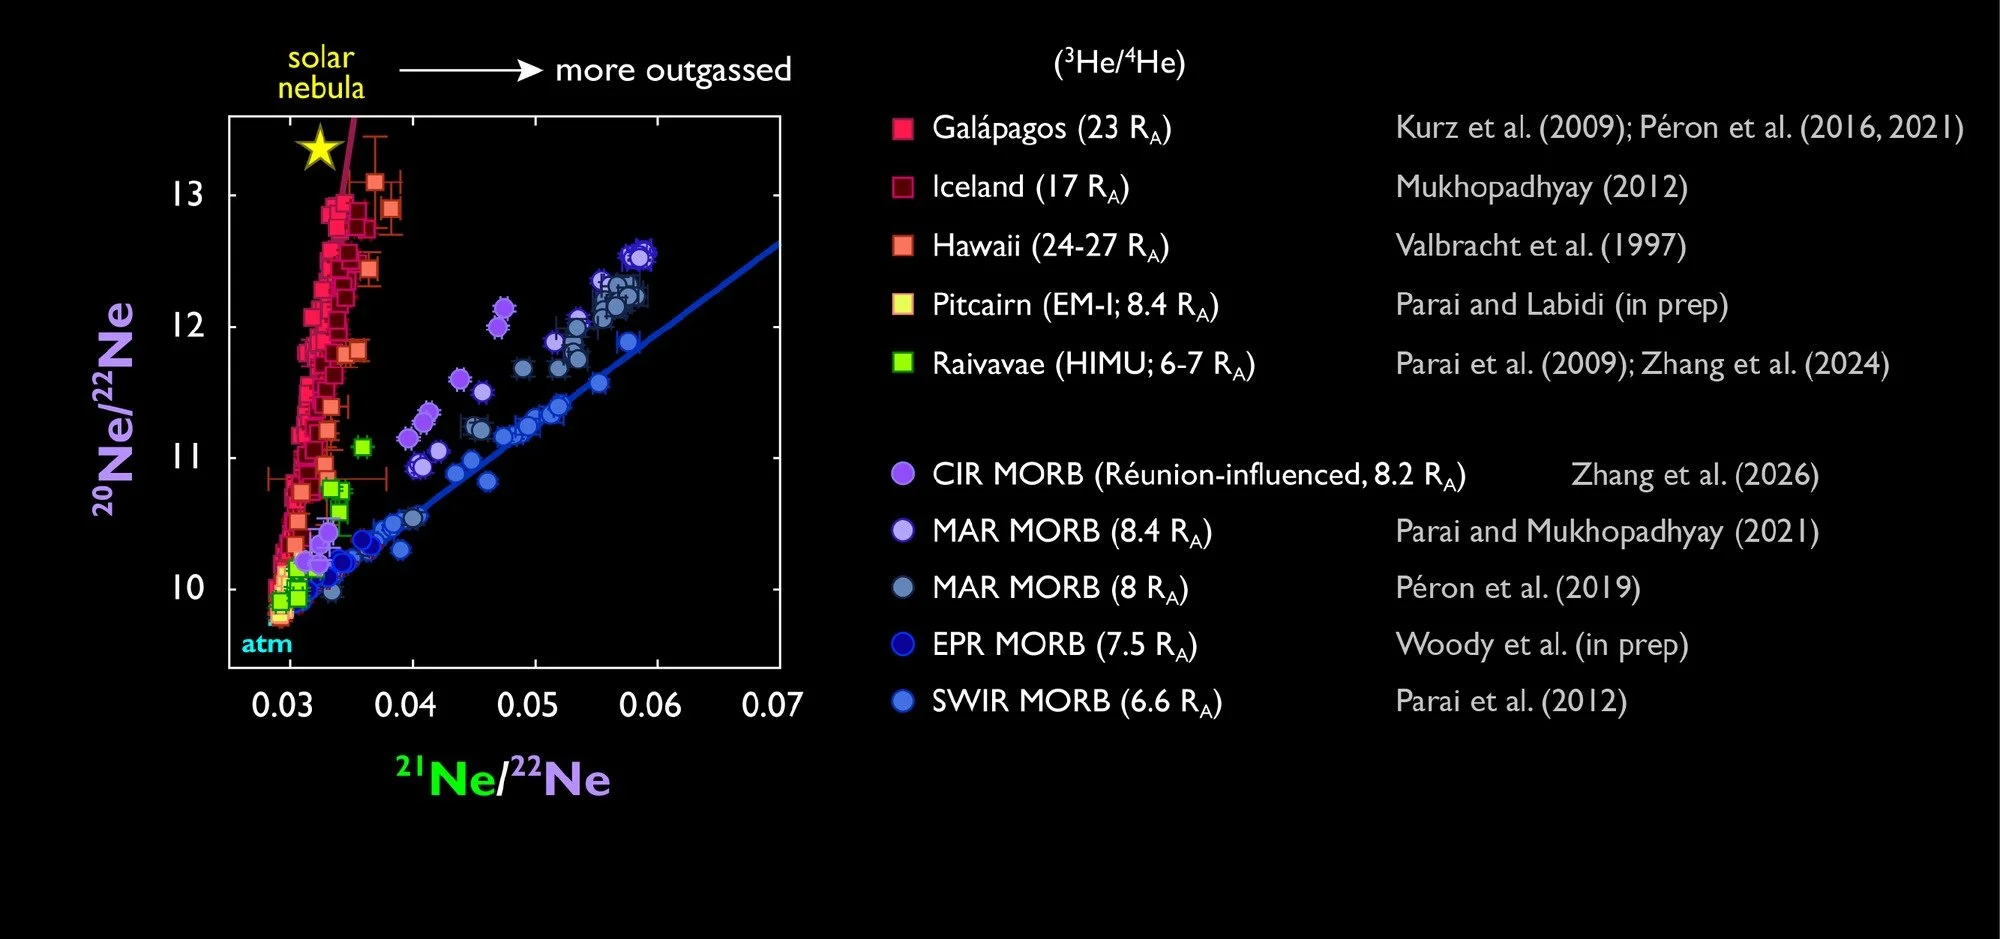
Neon tells the same story. Each line of points runs from air (atm, bottom left), which contaminates almost every sample, toward the composition of the mantle source. Lines from ocean islands (squares) are steep, and lines from mid-ocean ridges (circles) are shallower. A steeper line means less radiogenic neon-21 relative to primordial neon-22, again the mark of a source that has lost less gas. Each source's helium ratio is given in brackets.
Courtesy of Rita Parai; data from the sources listed
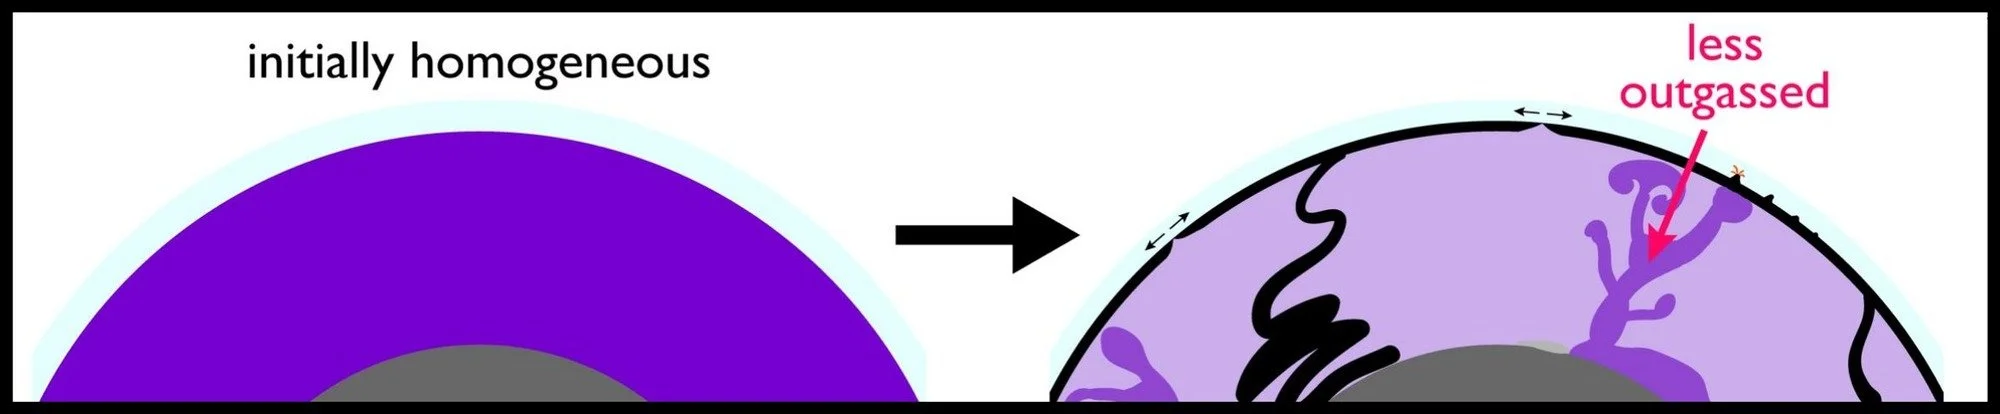
The conventional picture. The mantle starts out with the same composition throughout (left). Melting at ridges then strips gas from the upper mantle much more than from the source of plumes, which keeps more of its original gas (right). In the podcast, Rita Parai explains that helium, neon and argon all point this way: the plume source has been less processed by melting over Earth's history.
Courtesy of Rita Parai; after Gonnermann, H.M., and Mukhopadhyay, S. (2009), Nature 459:560
Where the Volatiles Came From
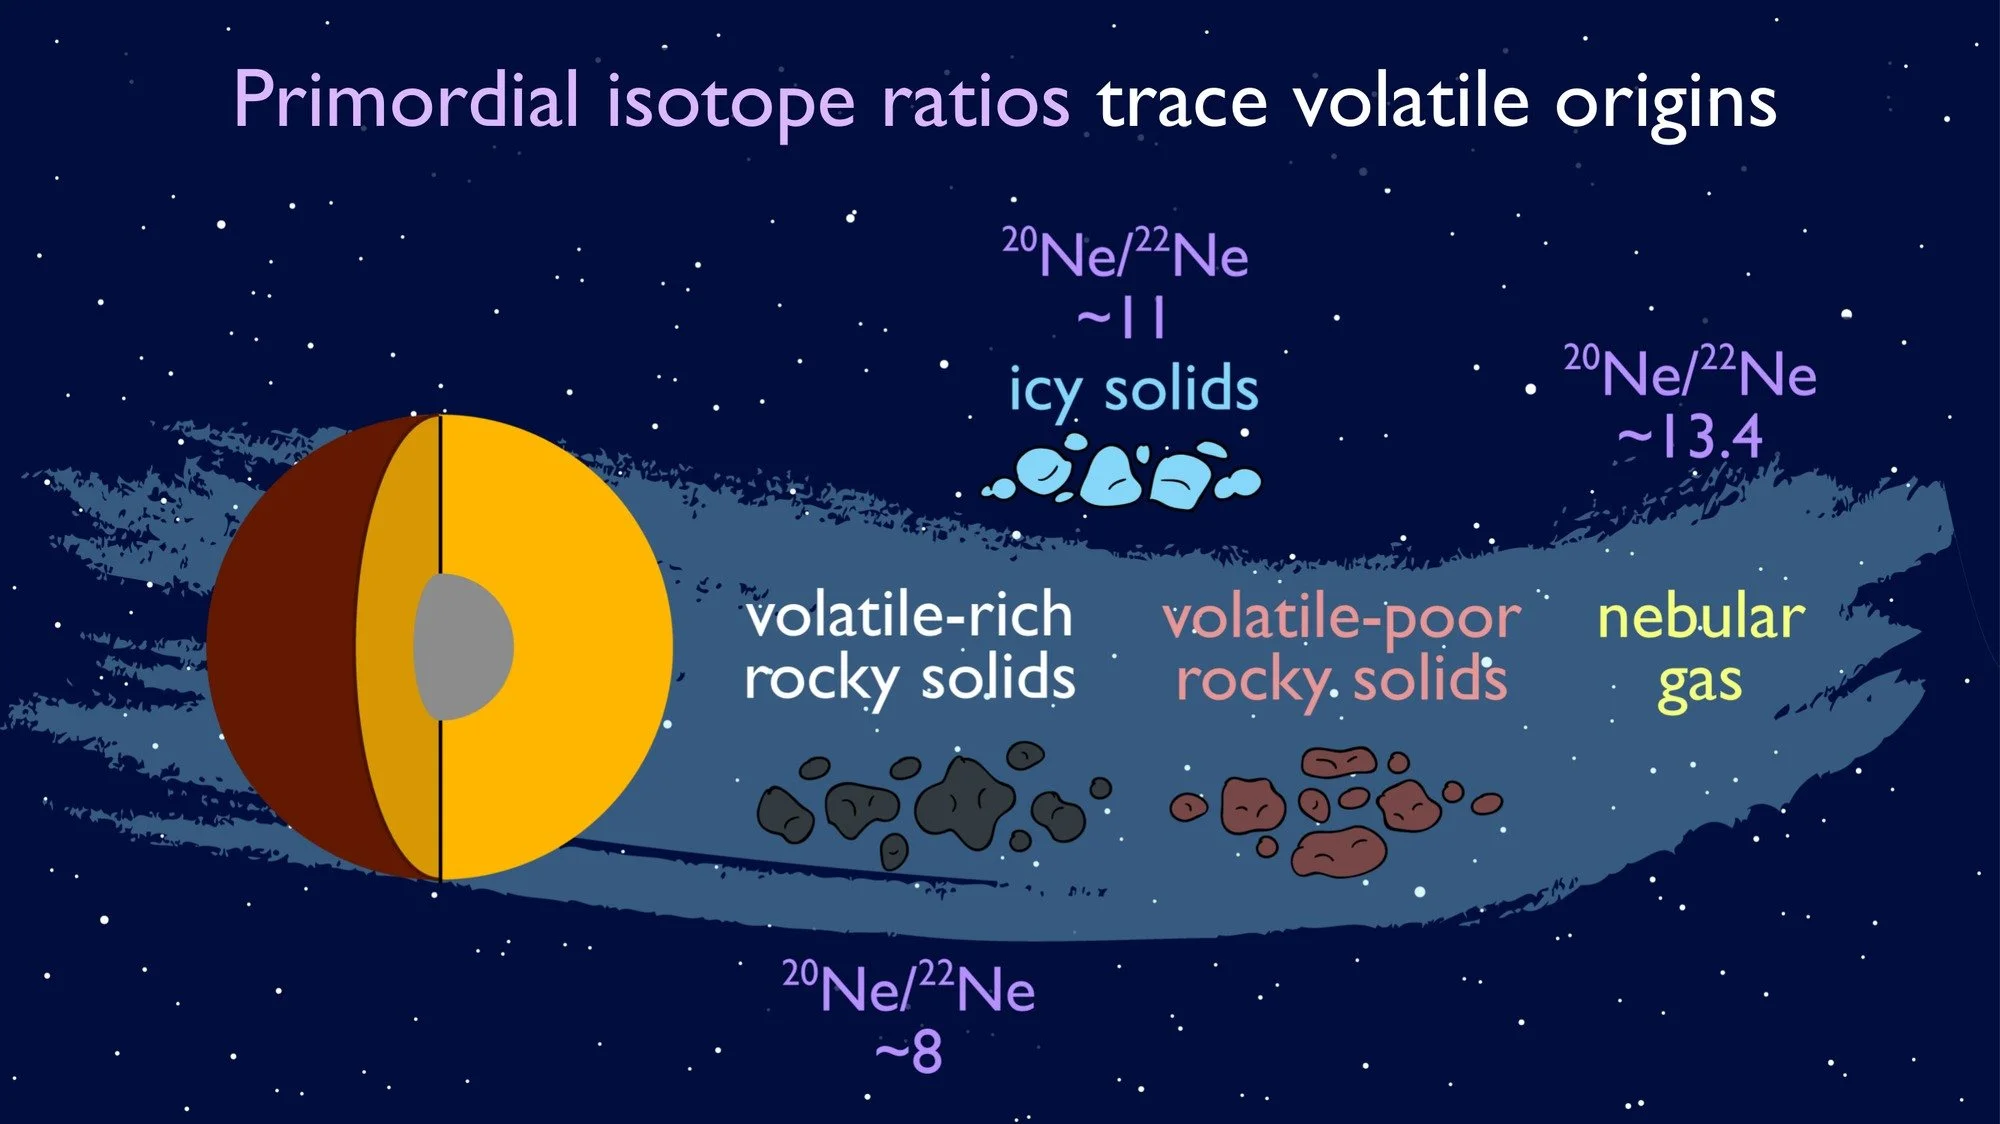
The Earth's volatiles could have come from several sources, each with its own fingerprint in its primordial isotopes. The ratio of neon-20 to neon-22 is about 13.4 in gas from the solar nebula, about 8 in volatile-rich rocky material like the carbonaceous chondrites in meteorite collections, and about 11 in comets (icy solids). The sources also differ in their proportions of the noble gases: nebular gas is rich in helium and neon but poor in xenon, while volatile-rich rock is rich in xenon.
Courtesy of Rita Parai
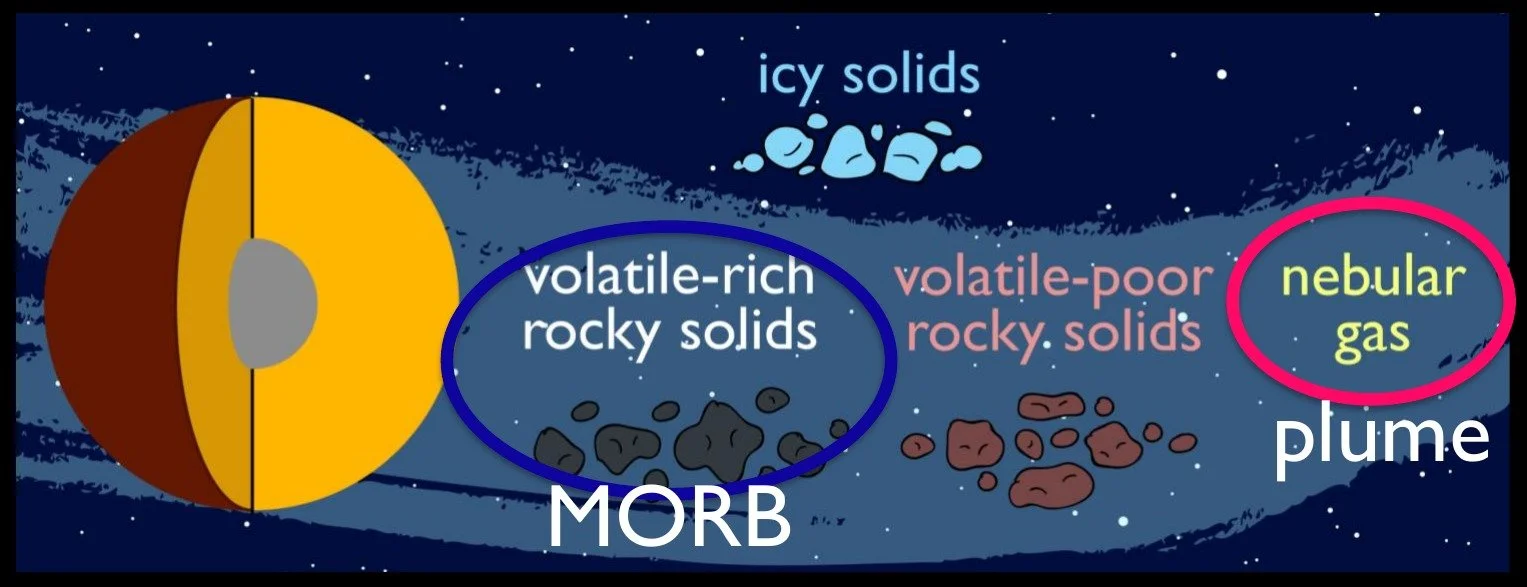
Working back from the primordial isotopes measured today, Rita Parai calculated the mix of sources in each part of the mantle. Both contain nebular gas, but the upper mantle that feeds mid-ocean ridges (MORB, blue circle) got more of its volatiles from volatile-rich rocky material than the deep source of plumes did (plume, pink circle). In the podcast, she suggests that this may reflect material that arrived late, after the last giant impact, and was mixed mainly into the upper mantle.
Courtesy of Rita Parai; after Parai, R. (2022), Proceedings of the National Academy of Sciences 119:e2201815119
Less Outgassed, and Dry From the Start
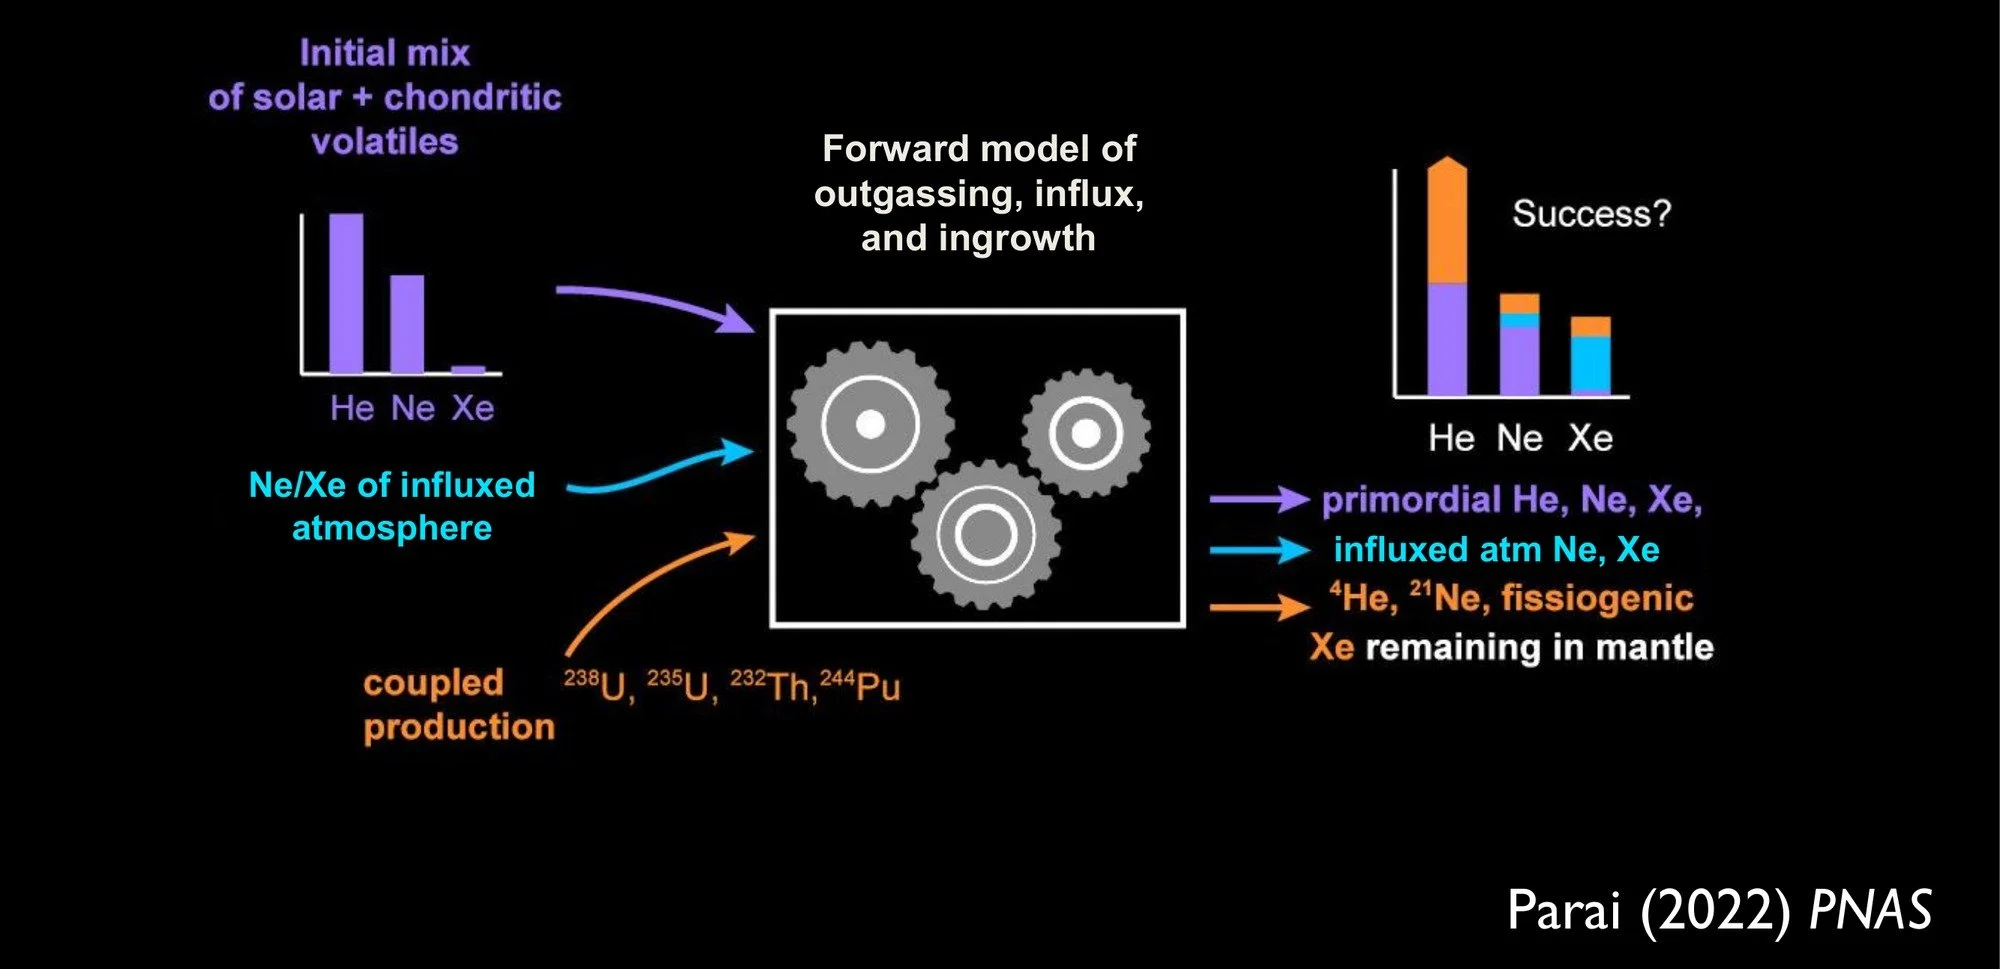
To find out how each part of the mantle reached its present state, Rita Parai ran a forward model. It starts with a mix of solar and chondritic volatiles (left) and follows four and a half billion years of outgassing, atmospheric gas carried in by subduction (blue), and new isotopes made by radioactive decay (orange). She tried many combinations of starting gas content and amount of outgassing. A run counts as a success only if it reproduces today's helium, neon and xenon isotope ratios in the mantle, all at once (right).
Courtesy of Rita Parai; after Parai, R. (2022), Proceedings of the National Academy of Sciences 119:e2201815119
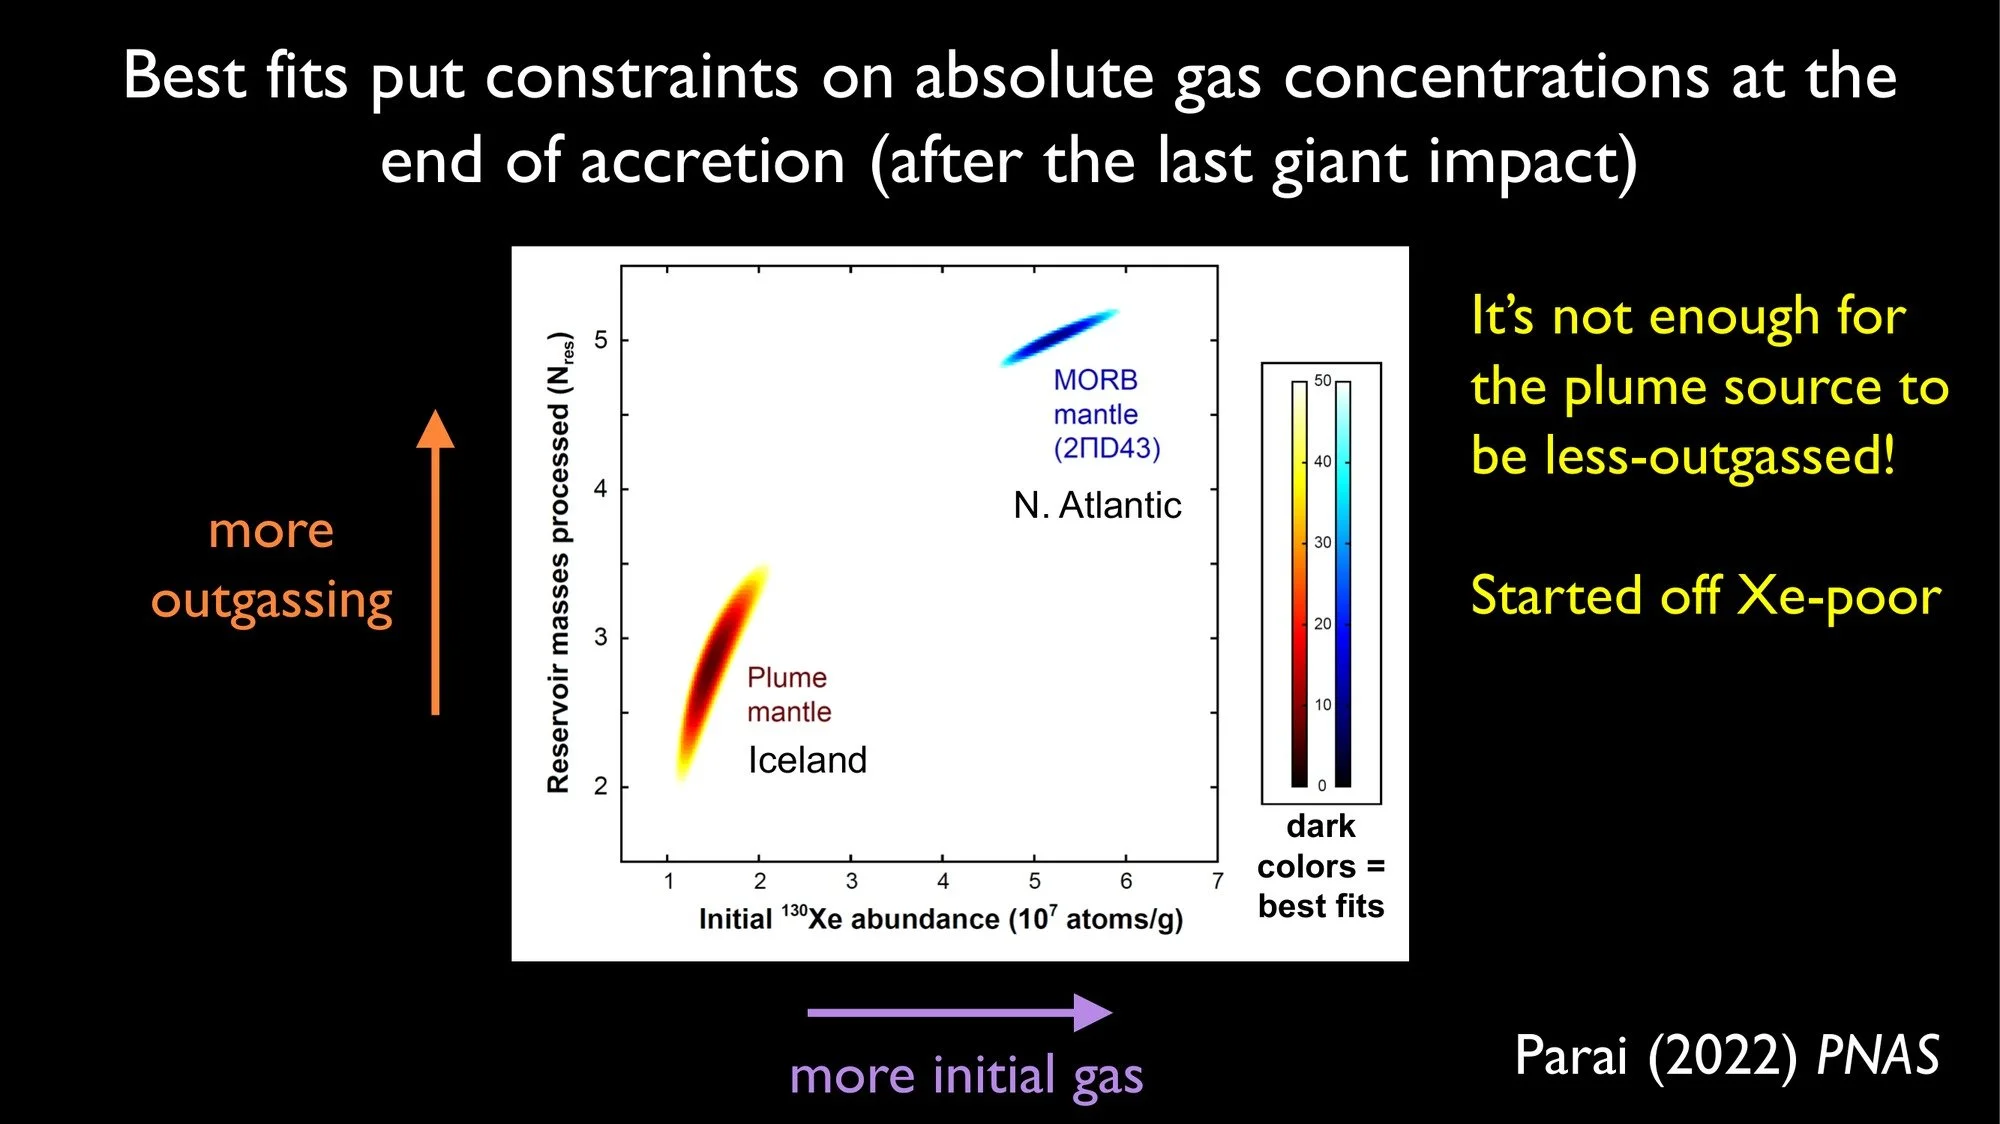
The plot shows which values of the two key parameters in Parai's model reproduce the noble gas abundances measured today in both the plume source and the shallow mantle that feeds mid-ocean ridges (the MORB source). The horizontal axis is how much xenon each reservoir held at the end of Earth's accretion, after the last giant impact. The vertical axis is how much it has been outgassed since then: the number of times a mass of mantle equal to the whole reservoir has passed through melting and lost its gas. Dark colors mark the best fits. The upper mantle beneath the North Atlantic (top right) needs both more starting xenon and more outgassing. The Iceland plume source (bottom left) needs less outgassing, as expected, but it also started with only about a quarter to a third as much xenon. So being less outgassed is not enough to explain the plume source: it started off xenon-poor.
Courtesy of Rita Parai; after Parai, R. (2022), Proceedings of the National Academy of Sciences 119:e2201815119
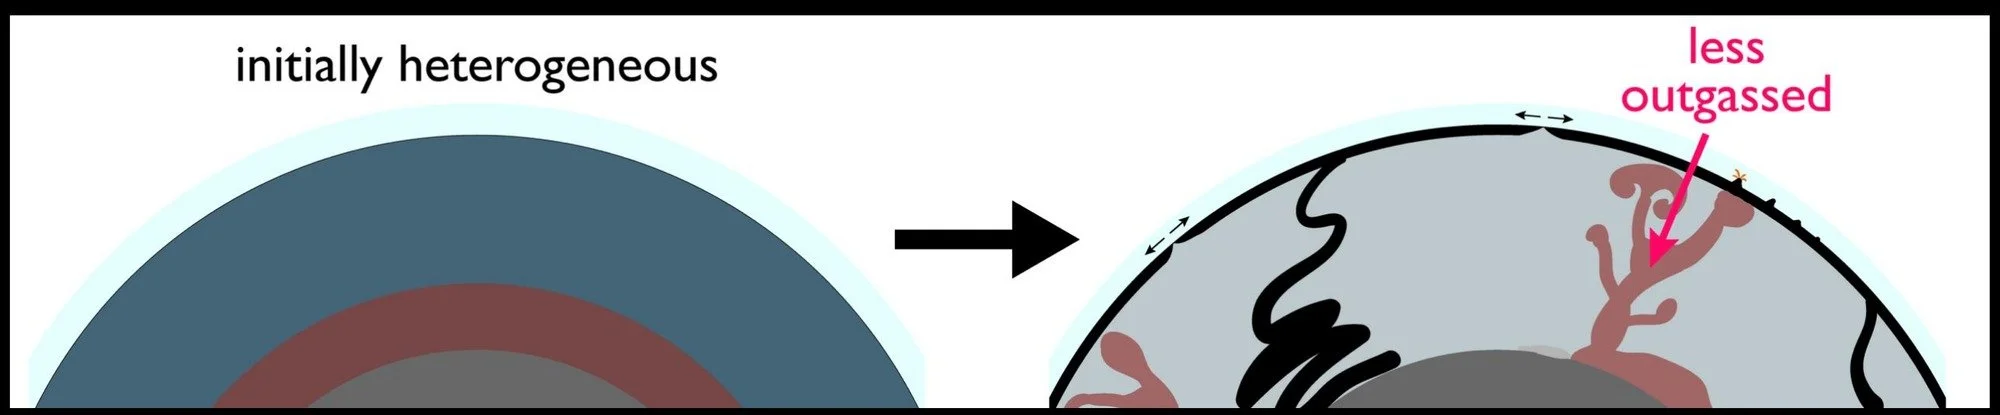
The picture that emerges. The deep mantle that now feeds plumes (red) starts out with a different mix of volatiles from the upper mantle (blue), including much less xenon, and so less water. It is still the less outgassed of the two today (right), but less outgassing alone cannot explain its noble gases. Compare the conventional picture above.
Courtesy of Rita Parai; after Parai, R. (2022), Proceedings of the National Academy of Sciences 119:e2201815119
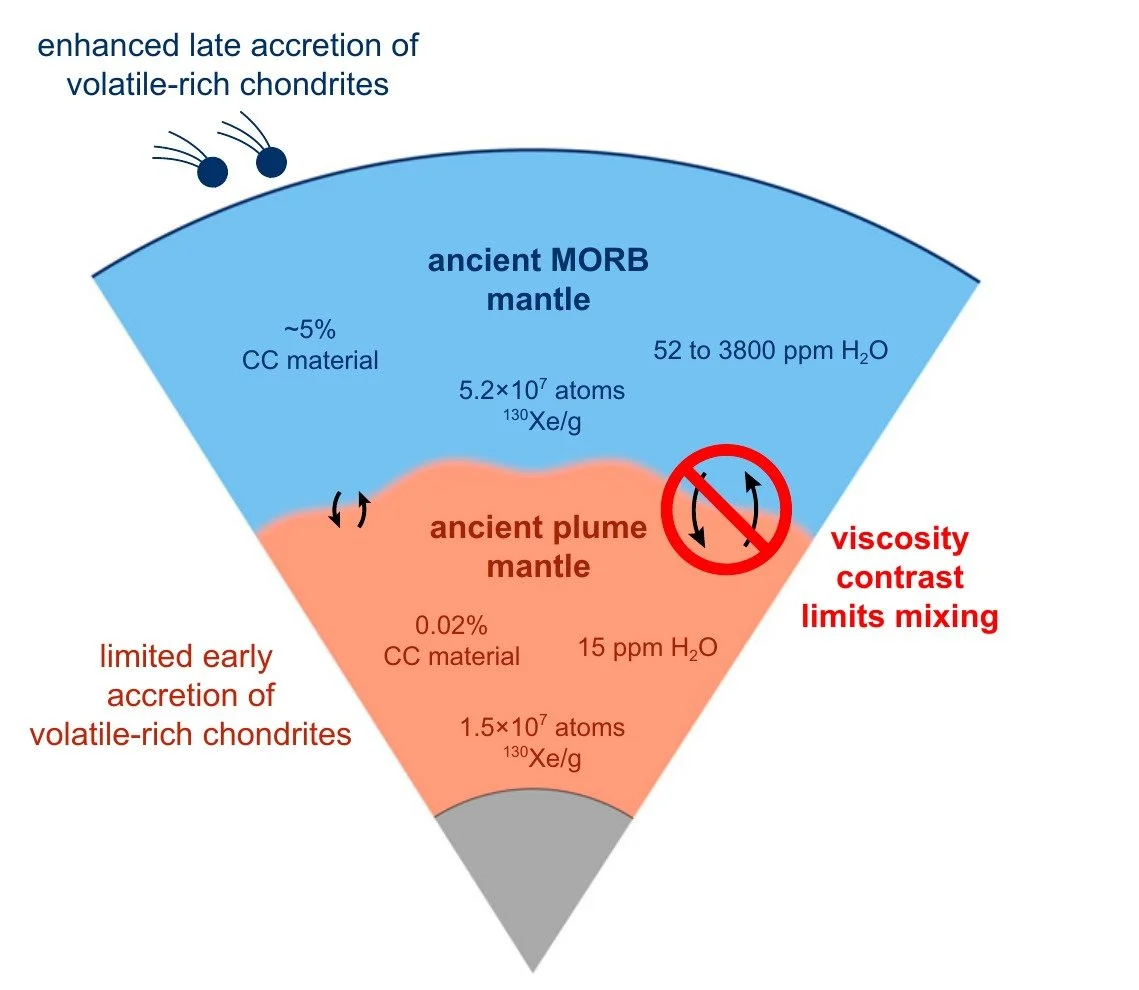
The two parts of the mantle at the end of accretion, as reconstructed by Rita Parai. The ancient upper mantle, which now feeds mid-ocean ridges (blue), took in more volatile-rich material resembling carbonaceous chondrites (CC material), perhaps late in accretion, and ended up with an estimated 52 to 3,800 parts per million of water. The ancient plume mantle (orange) took in much less and ended up with about 15 parts per million, between about 4 and 250 times drier. In the podcast, she explains that water makes mantle rock much less viscous, so a dry plume mantle would have been stiff enough to resist mixing. That may explain why giant impacts did not homogenize the growing Earth, and why signatures formed in the Earth's first hundred million years, in xenon-129 and tungsten-182, survive in plume sources today.
From Parai, R. (2022), Proceedings of the National Academy of Sciences 119:e2201815119 (CC BY-NC-ND 4.0)
From Dry to Wet
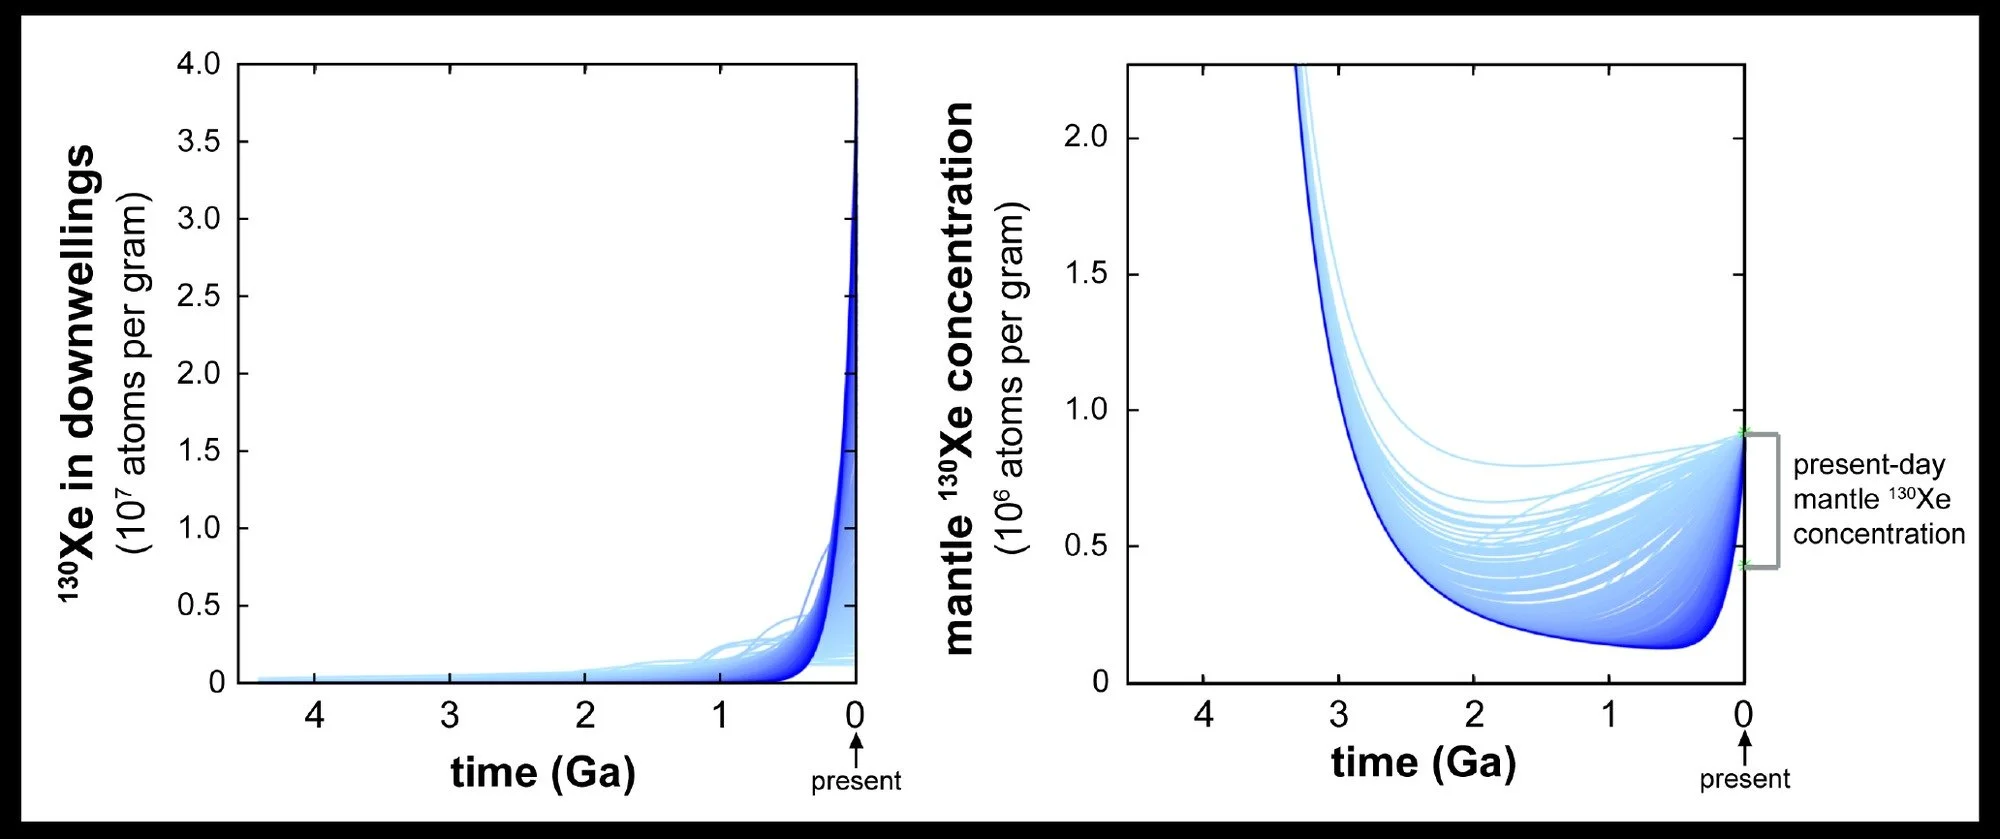
Today the plume source is the wetter of the two, with about 400 to 1,000 parts per million of water against about 50 to 200 in the upper mantle. So most of its water is not primordial: it was carried down by subducting slabs, or picked up as plumes rose through the transition zone. Xenon helps date when slabs began carrying water deep, because water-bearing minerals carry xenon too. These are model histories of the upper mantle by Rita Parai and Sujoy Mukhopadhyay, each one consistent with the mantle's xenon today. In all of them, sinking slabs carried little xenon into the mantle before about 2.5 billion years ago (left), because xenon from the older atmosphere had a distinctive isotopic composition that is not seen in the mantle. The upper mantle's xenon (right) fell steeply early on as it outgassed, then leveled off, and for the last 2 billion years or so slightly more has been carried in than lost. In the podcast, Rita Parai explains that this dates when slabs became cold enough to carry volatiles deep, not the start of plate tectonics. As Geoff Abers described in his episode, it is the cold slabs that carry water deepest.
Courtesy of Rita Parai; after Parai, R., and Mukhopadhyay, S. (2018), Nature 560:223
Behind the Measurements
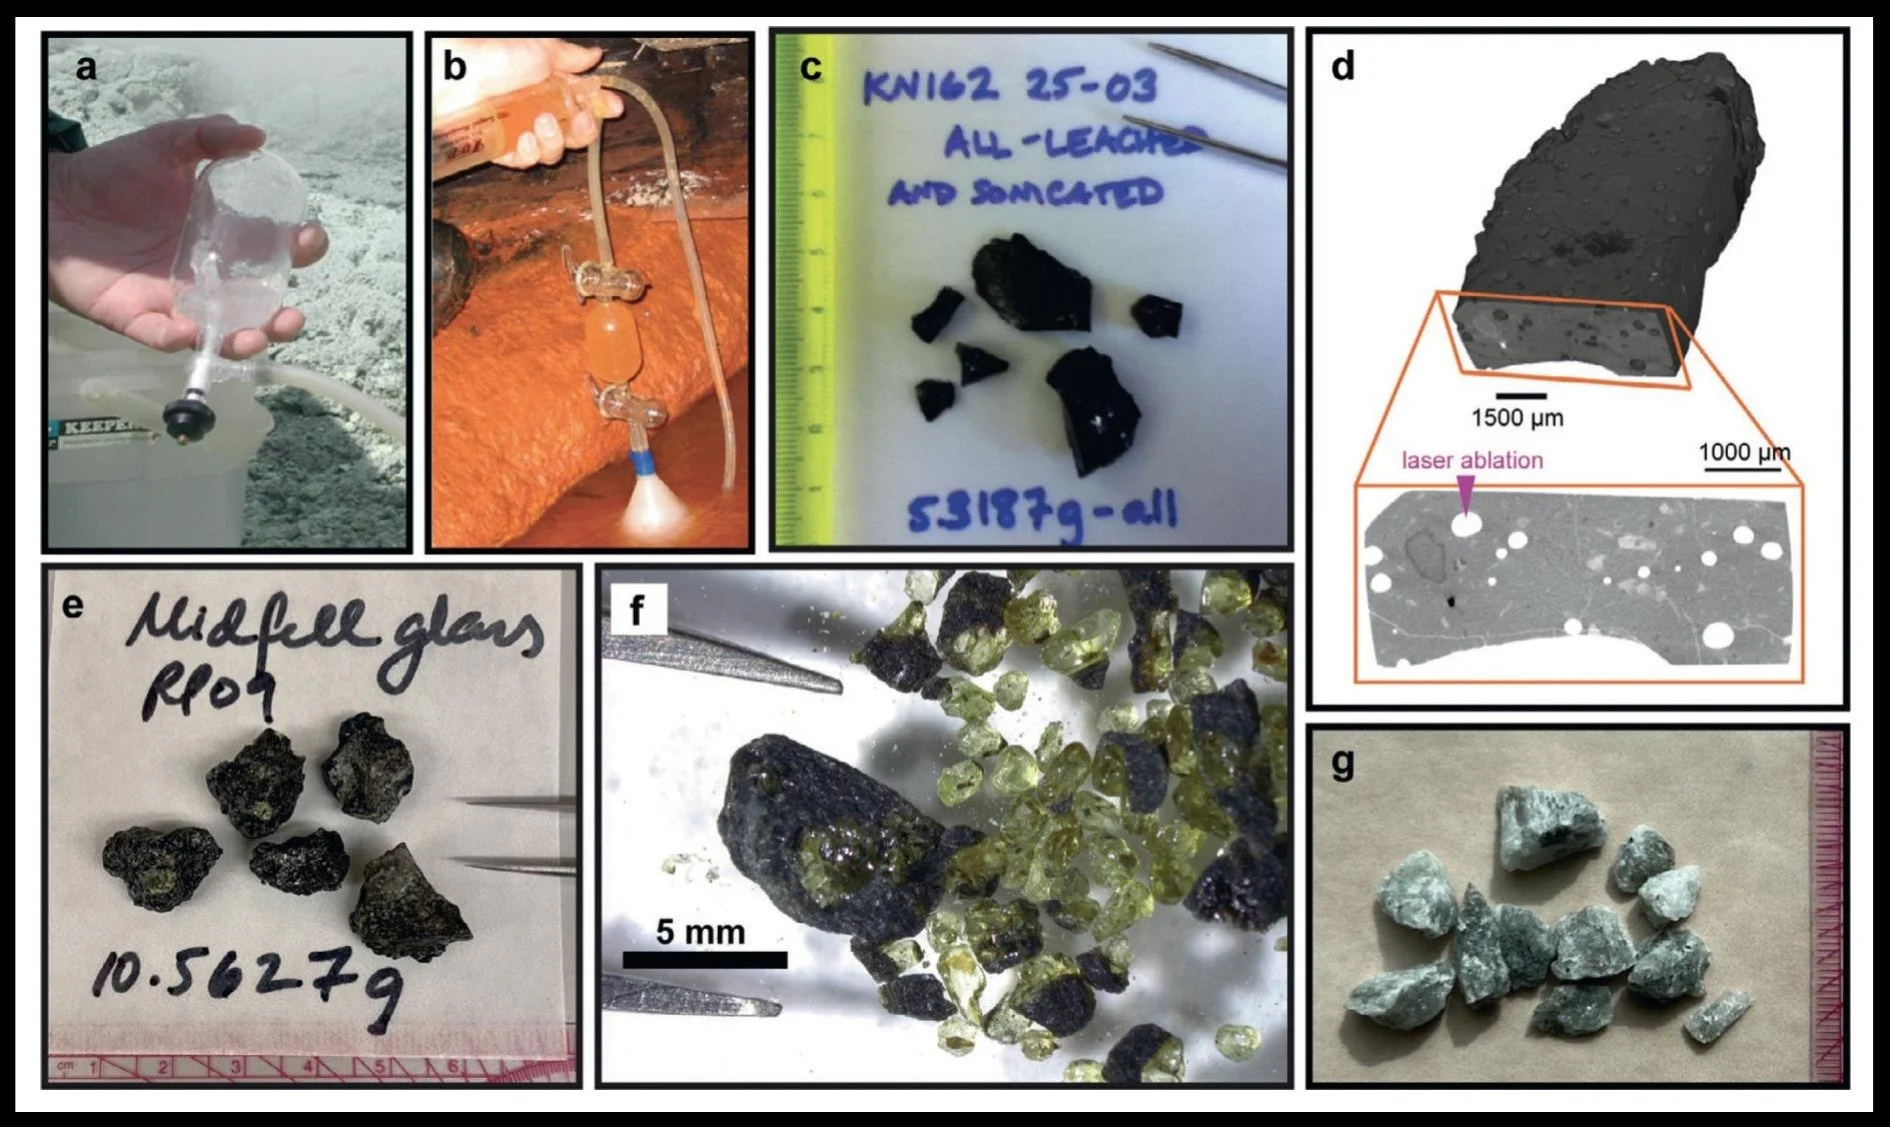
Mantle noble gases are measured in many kinds of sample, including chips of glassy basalt from mid-ocean ridges and ocean islands, which trap gas in bubbles, and crystals such as olivine (f), which trap it in tiny fluid inclusions. The glass in panel e is from Midfell in Iceland. In the podcast, Rita Parai explains that snapshots of the mantle from billions of years ago will have to come from rocks preserved in the continental crust.
Courtesy of Rita Parai; from Parai, R. (2025), Treatise on Geochemistry (3rd edition) 1:513, and references therein
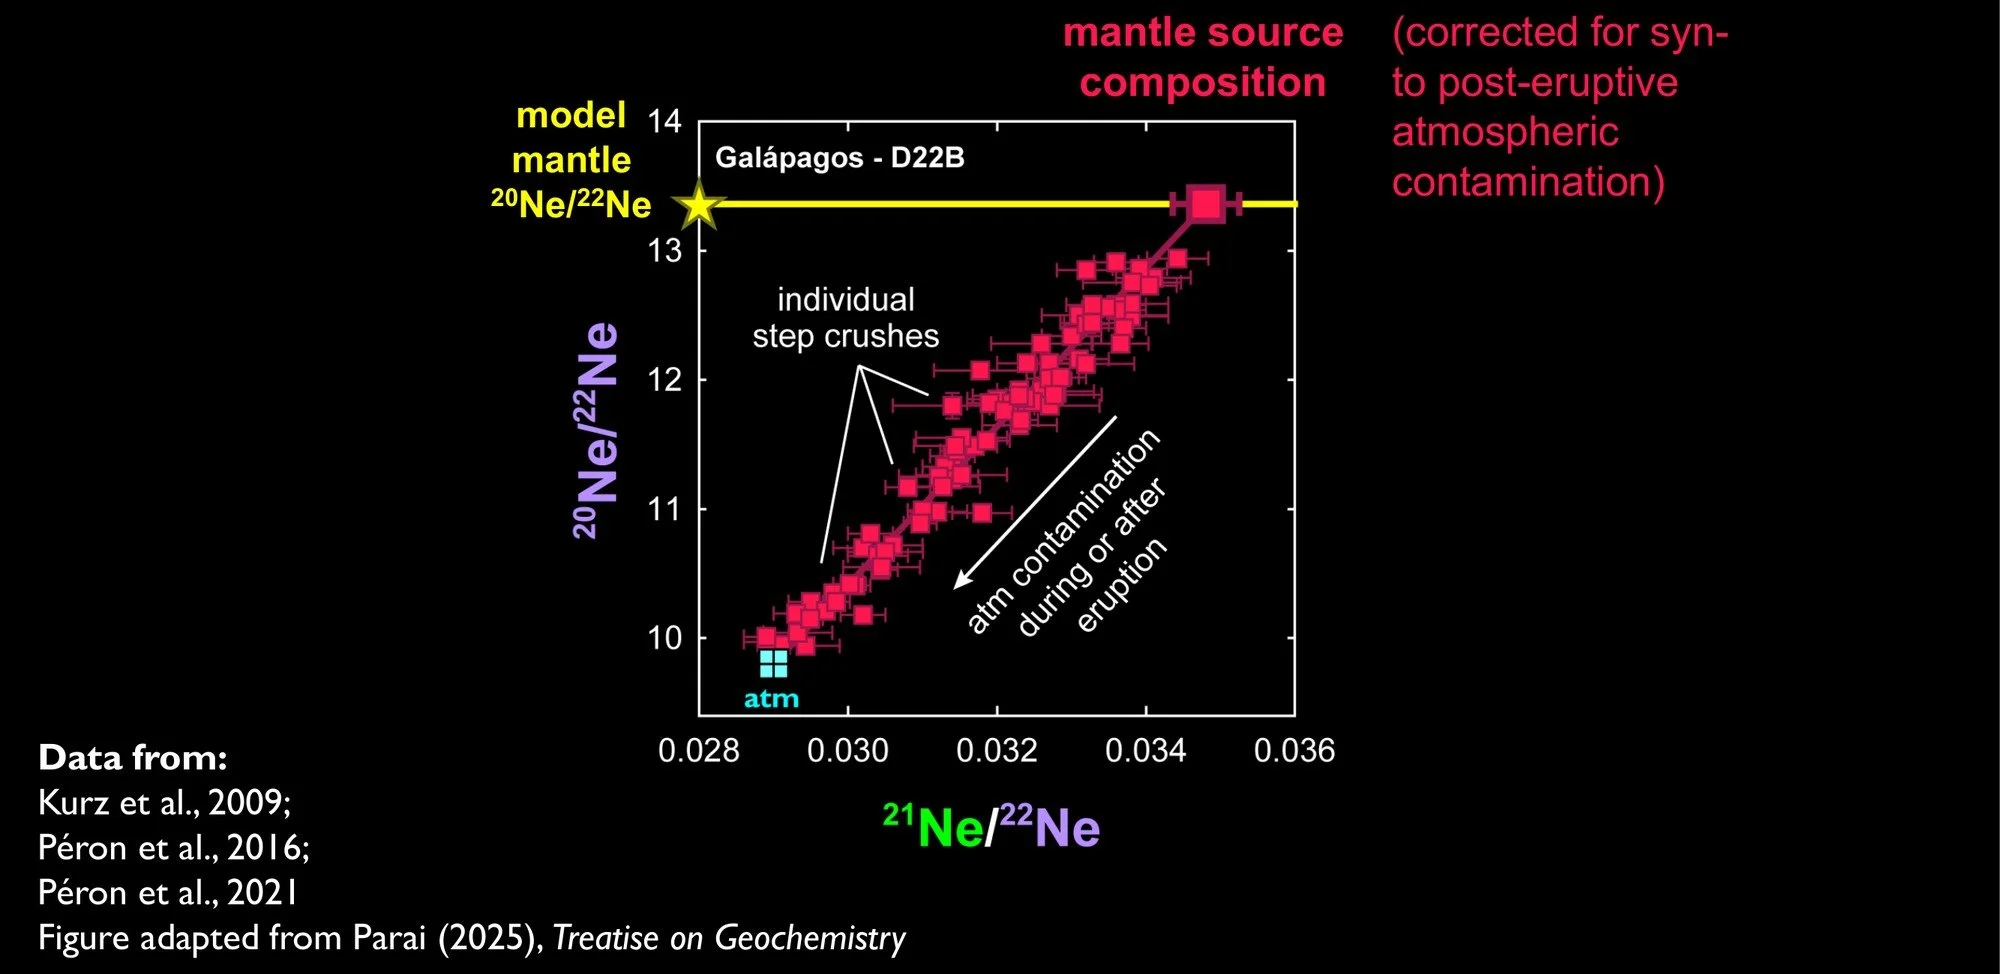
Air contaminates almost every sample, so the mantle's own signal has to be teased out. One way is to crush a sample in many small steps. Each step releases gas from different bubbles, some more contaminated than others, so the results fall on a line between air (atm, bottom left) and the mantle source. Here, for a basalt from the Galápagos, extending the line to the mantle's neon-20 to neon-22 ratio (yellow line) gives the source's composition, corrected for air (large square).
Courtesy of Rita Parai; adapted from Parai, R. (2025), Treatise on Geochemistry (3rd edition) 1:513, with data from Kurz et al. (2009) and Péron et al. (2016, 2021)
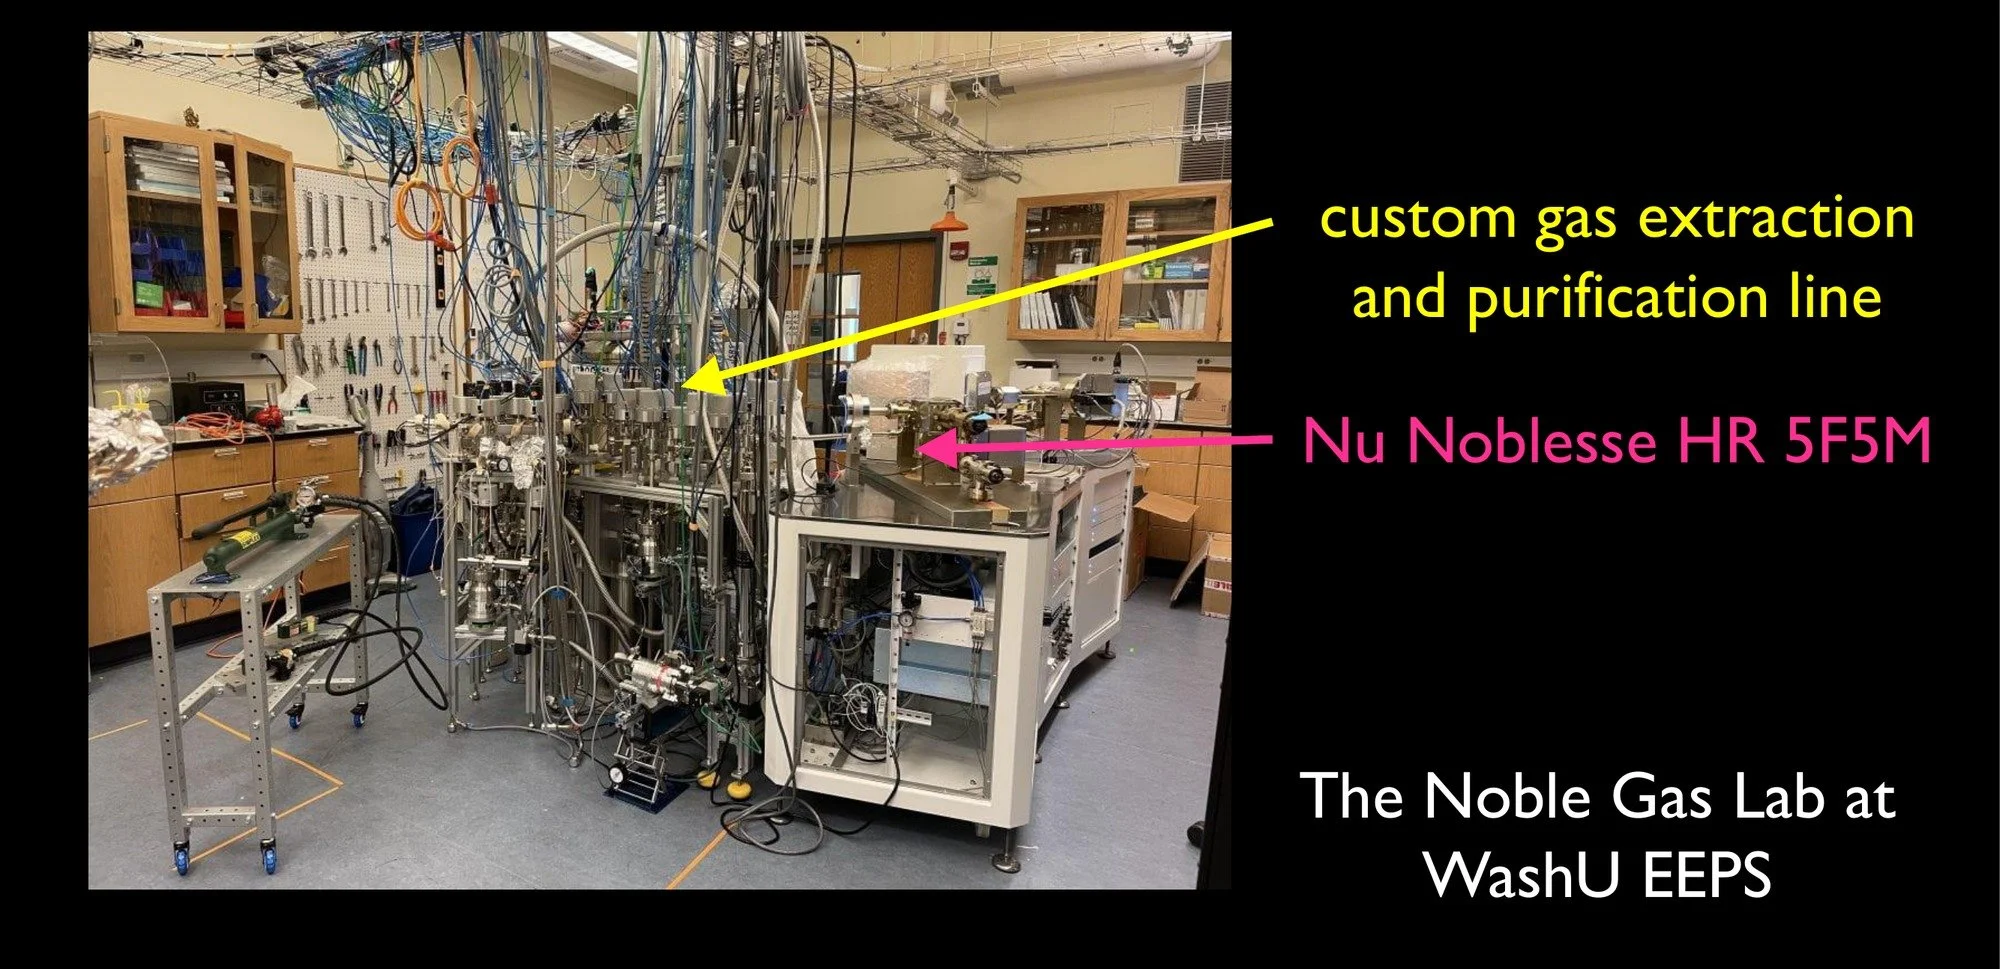
The Noble Gas Laboratory at Washington University in St. Louis. Gas released from a sample passes through a custom extraction and purification line (yellow arrow), which removes other gases and separates the noble gases, before a Nu Noblesse HR mass spectrometer (pink arrow) measures the abundance of each isotope.
Courtesy of Rita Parai