
Sonia Tikoo on the Moon’s Magnetic Field
Listen to the podcast here or wherever you get your podcasts.
We have known for decades that the Moon once generated a strong magnetic field — comparable in strength to Earth's — throughout the period from about 4.25 to 3.5 billion years ago. Only in the past few years have we learned that the field didn't simply switch off then: it weakened dramatically but lingered on, faintly, until as recently as 1.5 billion years ago, before disappearing entirely. As Sonia Tikoo explains in the podcast, we don't really understand either how the early field grew so strong or how any field could last so long — and no single mechanism seems able to account for both the intense early epoch and the long, weak tail that followed.
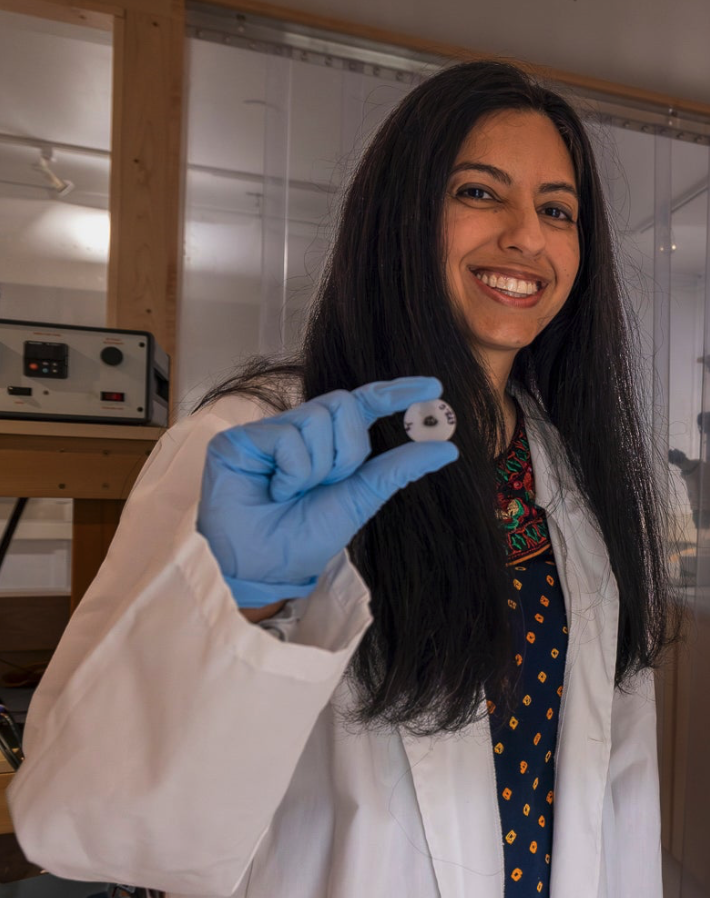
Sonia Tikoo studies the history of magnetic fields on the Moon and other small solar system bodies using paleomagnetism and fundamental rock magnetism. She is an Assistant Professor in the Department of Geophysics at Stanford University.
In the photo she is holding a lunar mare basalt sample.
Photo: Harry Gregory/Stanford University
Podcast Illustrations
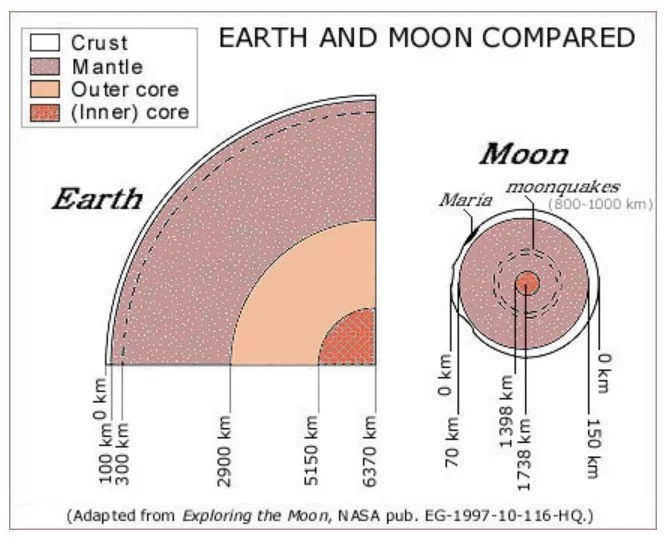
The Moon is much smaller than the Earth, and its core occupies a smaller fraction of the Moon’s volume than that of the Earth. As Tikoo explains in the podcast, the scaling laws that apply to the magnetic field strength generated by core-driven convection suggest that the Moon’s magnetic field should be a fraction of a microtesla (μT). Instead, rock samples returned from the Moon indicate a much stronger field of 20 - 100 μT 4.5 to 3.5 billion years ago.
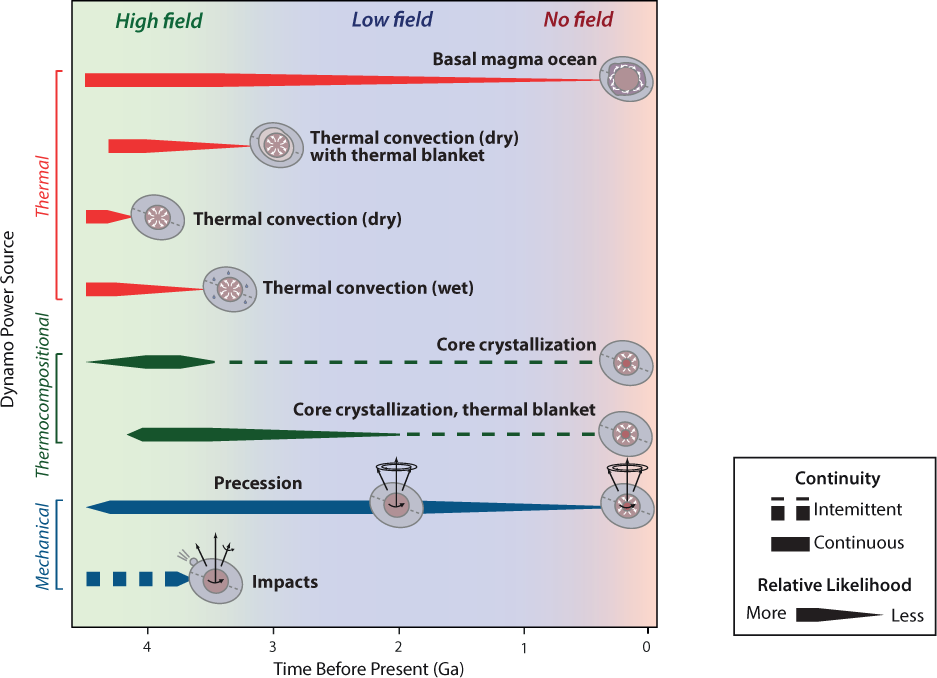
Compilation of the estimated timing of magnetic-field-generating mechanisms discussed in the podcast. Some of the longevities shown in the figure differ from those in the paleointensity vs. time plot (below) based on differences in the models selected by different authors.
Wieczorek, M.A. et al. (2023), Reviews in Mineralogy and Geochemistry 89 (1): 207
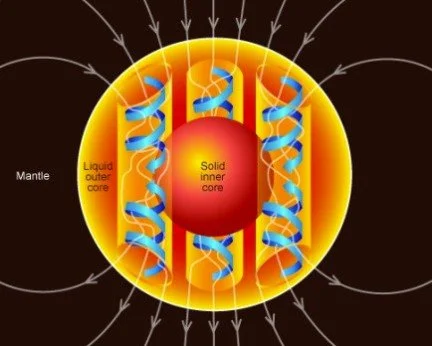
Dynamo Mechansim
This diagram was drawn to explain the Earth’s magnetic field, but the same principle is invoked for to explain the early strong lunar field. Temperature, composition, and pressure differences that occur within the outer liquid core cause convective motion. As the Moon is rotating, the Coriolis force acts on the moving fluid, organizing the motion into helical patterns (blue lines) aligned with the Moon’s spin axis. Electric current is generated in the moving fluid, which in turn generates the magnetic field (pink lines).
USGS
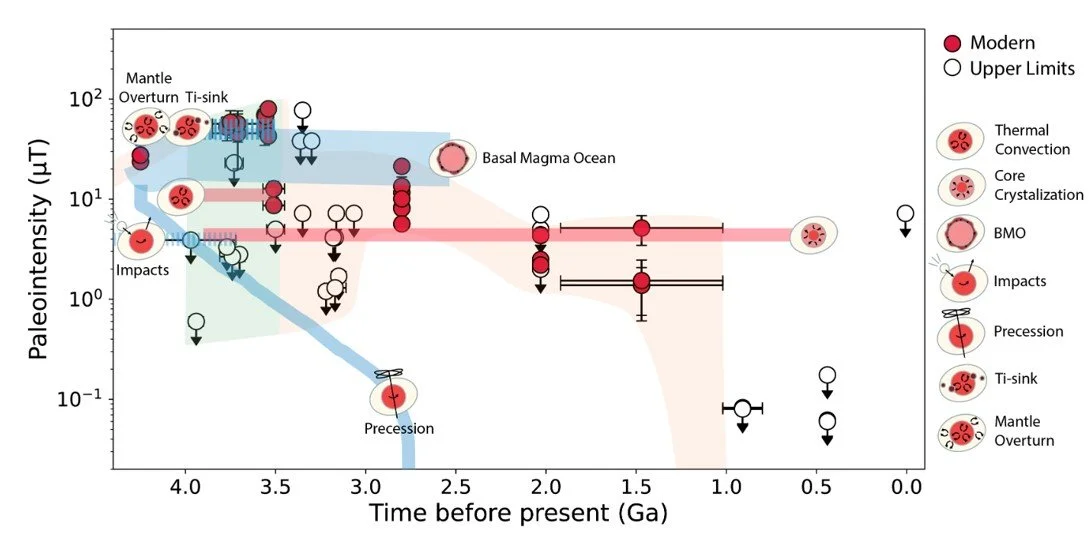
Plot showing current experimental estimates of the intensity of the lunar magnetic field over time. The shaded regions indicate ranges that can be explained by the various mechanisms discussed in the podcast. Pale green: the period of longevity for a dynamo purely powered by thermal core convection (without core crystallization) based on lunar thermal evolution modeling. Pale pink: the period for which core crystallization could facilitate a longer-lived dynamo, truncated at the younger end by the youngest age limit of the last sample that is interpreted to contain a dynamo record. Blue line: the estimated intensity and longevity of a non-traditional dynamo powered by a precession dynamo, assuming some “nominal model” for the Moon’s tidal recession rate away from the Earth over time. Thicker blue swatch: the estimated intensity and longevity of a non-traditional dynamo powered by convection of a lunar basal magma ocean (BMO). The blue hatched marks: the longevities of non-traditional dynamo mechanisms that are likely to operate only intermittently. The top one refers to a period where the dynamo may be related to interactions between foundered Ti-rich magma ocean cumulates (after magma ocean overturn) and the lunar core mantle boundary. The bottom hatched region refers to a mechanically driven dynamo powered by core instabilities that are generated after large basin-forming impacts on the Moon, which ceased around 3.7-3.8 Ga (the age of the youngest basin, Orientale). The red “moden” circles denote measurements made after 2000. The open circles with down arrows represent samples that behave as if they formed in the absence of a dynamo, but the experimental methods used mean that we can only place upper limits on the lunar field at the time.
Courtesy of Ji-in Jung, Stanford University
Lunar Samples Used for Magnetic Field Paleonintensity Measurements
Courtesy of NASA
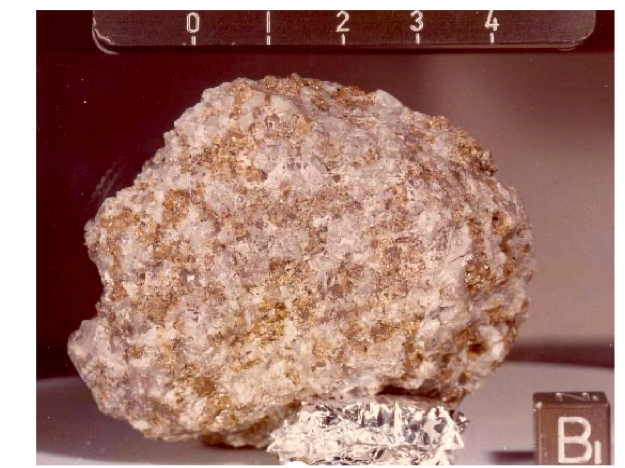
4.2-billion-year-old (Ga) troctolite, a coarse-grained, intrusive igneous rock composed primarily of olivine and calcium-rich plagioclase feldspar, with little to no pyroxene. The sample was collected by Apollo 17, and various studies have suggested the sample was excavated by an impact on the South Pole-Aitken basin on the lunar far side and delivered to the Apollo 17 landing site.
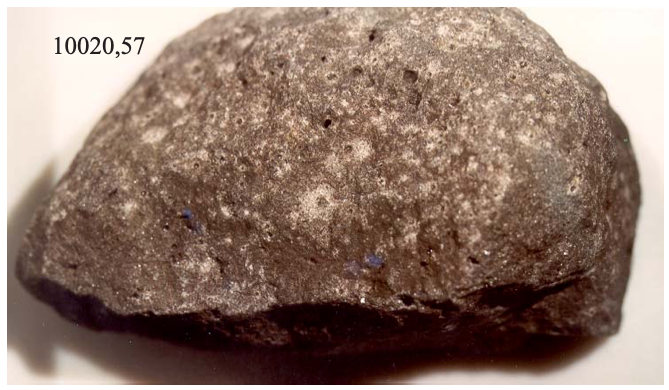
3.7 Ga mare basalt showing micrometeorite craters (zap pits). The sample is 6 cm long. This Apollo 14 sample provided critical evidence for a long-lived core dynamo on the Moon. By analyzing the high-coercivity magnetization of sample 10020, a study by Shea et al. effectively extended the known duration of the active lunar dynamo by 500 million years.
Shea, e.K. et al. (2012), Science 335 (6067): 453
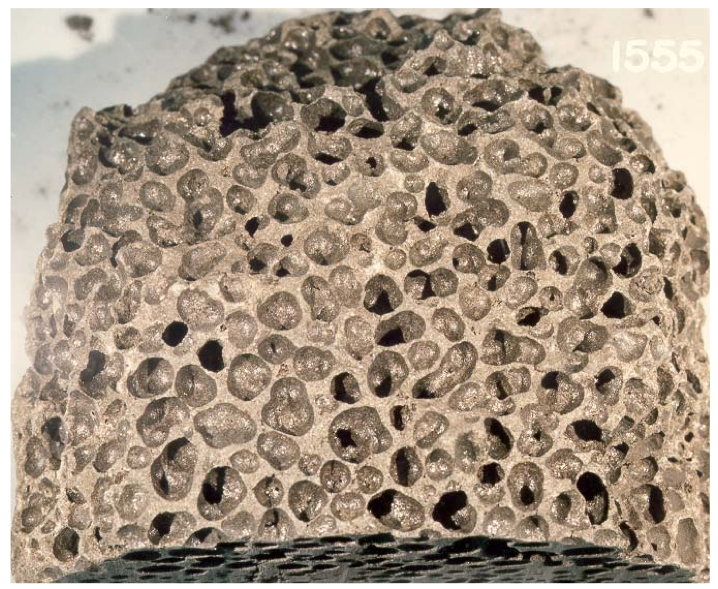
3.3 Ga mare basalt containing vesicles, the largest of which are about 6 mm across.
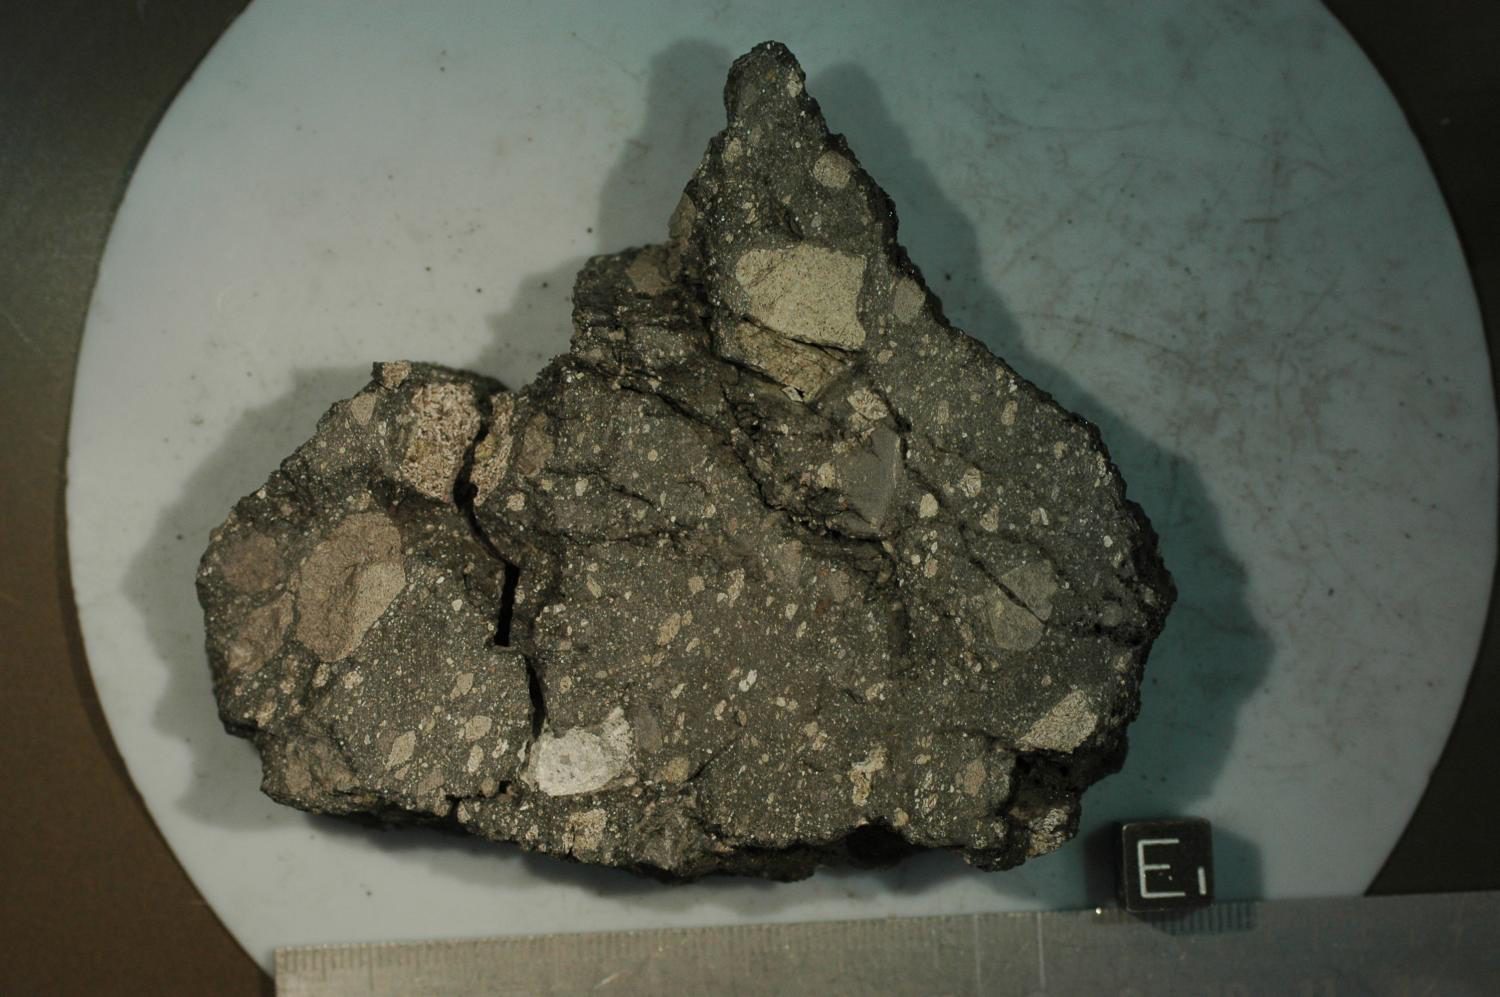
1.5 Ga regolith breccia collected during the Apollo 15 mission on August 1, 1971, on the southern rim of Dune Crater within eastern Mare Imbrium. In the picture of Tikoo shown at the top of this page, she is pointing to this sample, which is featured in Tikoo, S. M. et al. (2017), Science Advances, Vol 3, Issue 8 DOI: 10.1126/sciadv.170020.
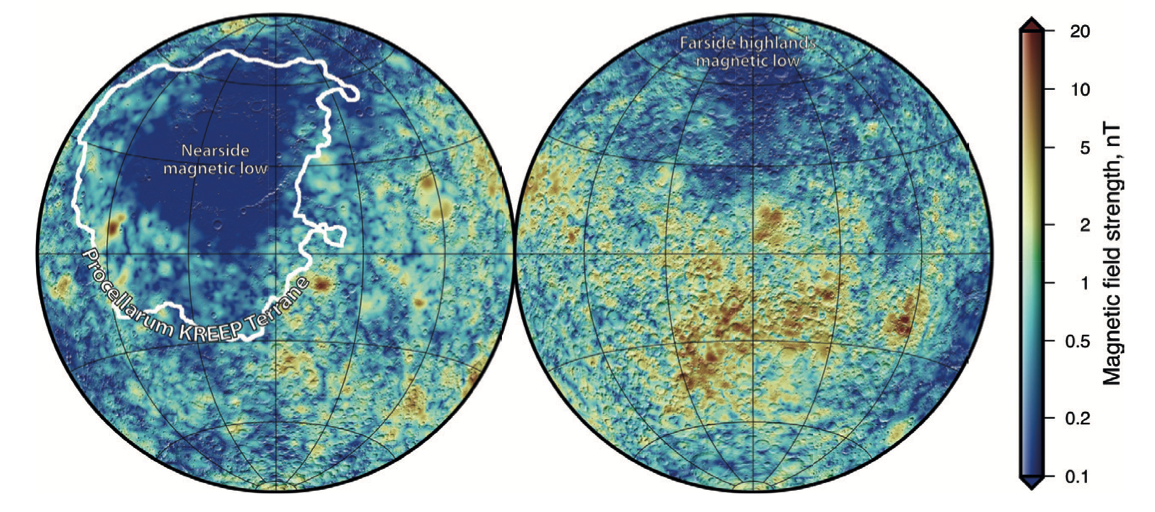
Lunar crustal field map showing total field strength at 30 km altitude. The map combines data from the magnetometer on the NASA Lunar Prospector spacecraft and the magnetometer on the JAXA Kaguya/SELENE spacecraft. The lunar swirl Reiner Gamma (see below) discussed by Tikoo in the podcast is the big red blobby area to the upper right of the “P” on the western edge of the Procellarum KREEP terrane outline. There are also some swirls within some of the red areas on the southern lunar farside (Mare Ingenii for example) and in the band at 90-120 degrees East (at the rim of the farside), between the equator and 30 degrees north (Mare Marginis). The map indicates a lower field on the farside North Pole. There is no consensus as to its origin. One hypothesis suggests that there isn’t much iron-rich material in the lower crust there; another proposes that there was a lot of radiogenic KREEP (Potassium (K), Rare-Earth Elements (REE), and Phosphorus (P)) there that kept the region hot such that the area didn’t cool below the 770 degrees C Curie temperature of metallic iron until after the dynamo declined in intensity.
Wieczorek, M.A. et al. (2023), Reviews in Mineralogy and Geochemistry 89 (1): 207
Lunar Swirls
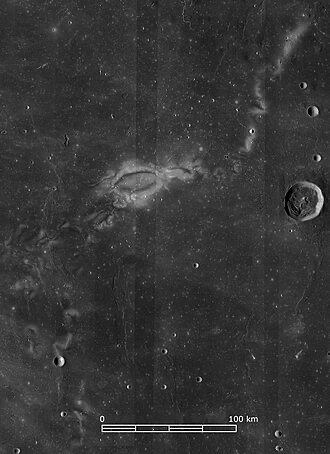
Lunar surface visible light image of Reiner Gamma swirl/magnetic anomaly showing a central oblong light region with wispy arms in a roughly open spiral pattern. In the podcast, Tikoo tells us that there is no detected compositional difference between the rocks of different albedo. So some workers have put forward the idea that the patterns reflect varying interactions of the local lunar magnetic field with the solar wind. These cause some regions to have vertical field lines along which the solar wind particles can travel to the surface causing space weathering, which can change the albedo of the affected rocks. In other regions, the field lines are horizontal and protect the surface from the solar wind.
NASA/LRO WAC Science team
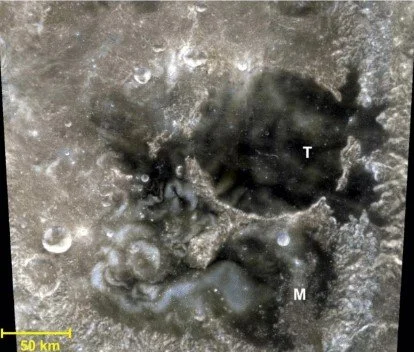
The Mare Ingenii swirls in the vicinity of the Imbrium basin antipode. Label T denotes the mare-flooded crater Thomson, which is 117 km in diameter. M is Thomson M, the large, partially mare-filled crater immediately south of Thomson.
NASA, Blewett, D.T. et al. (2011), Journal of Geophysical Research, 16, E02002 http://dx.doi.org/10.1029/2010JE003656