
Tony Watts on the Mechanics of Tectonic Plates
Listen to the podcast here or wherever you get your podcasts.
Podcast Illustrations
Four Key Moments in the Development of Plate Tectonics
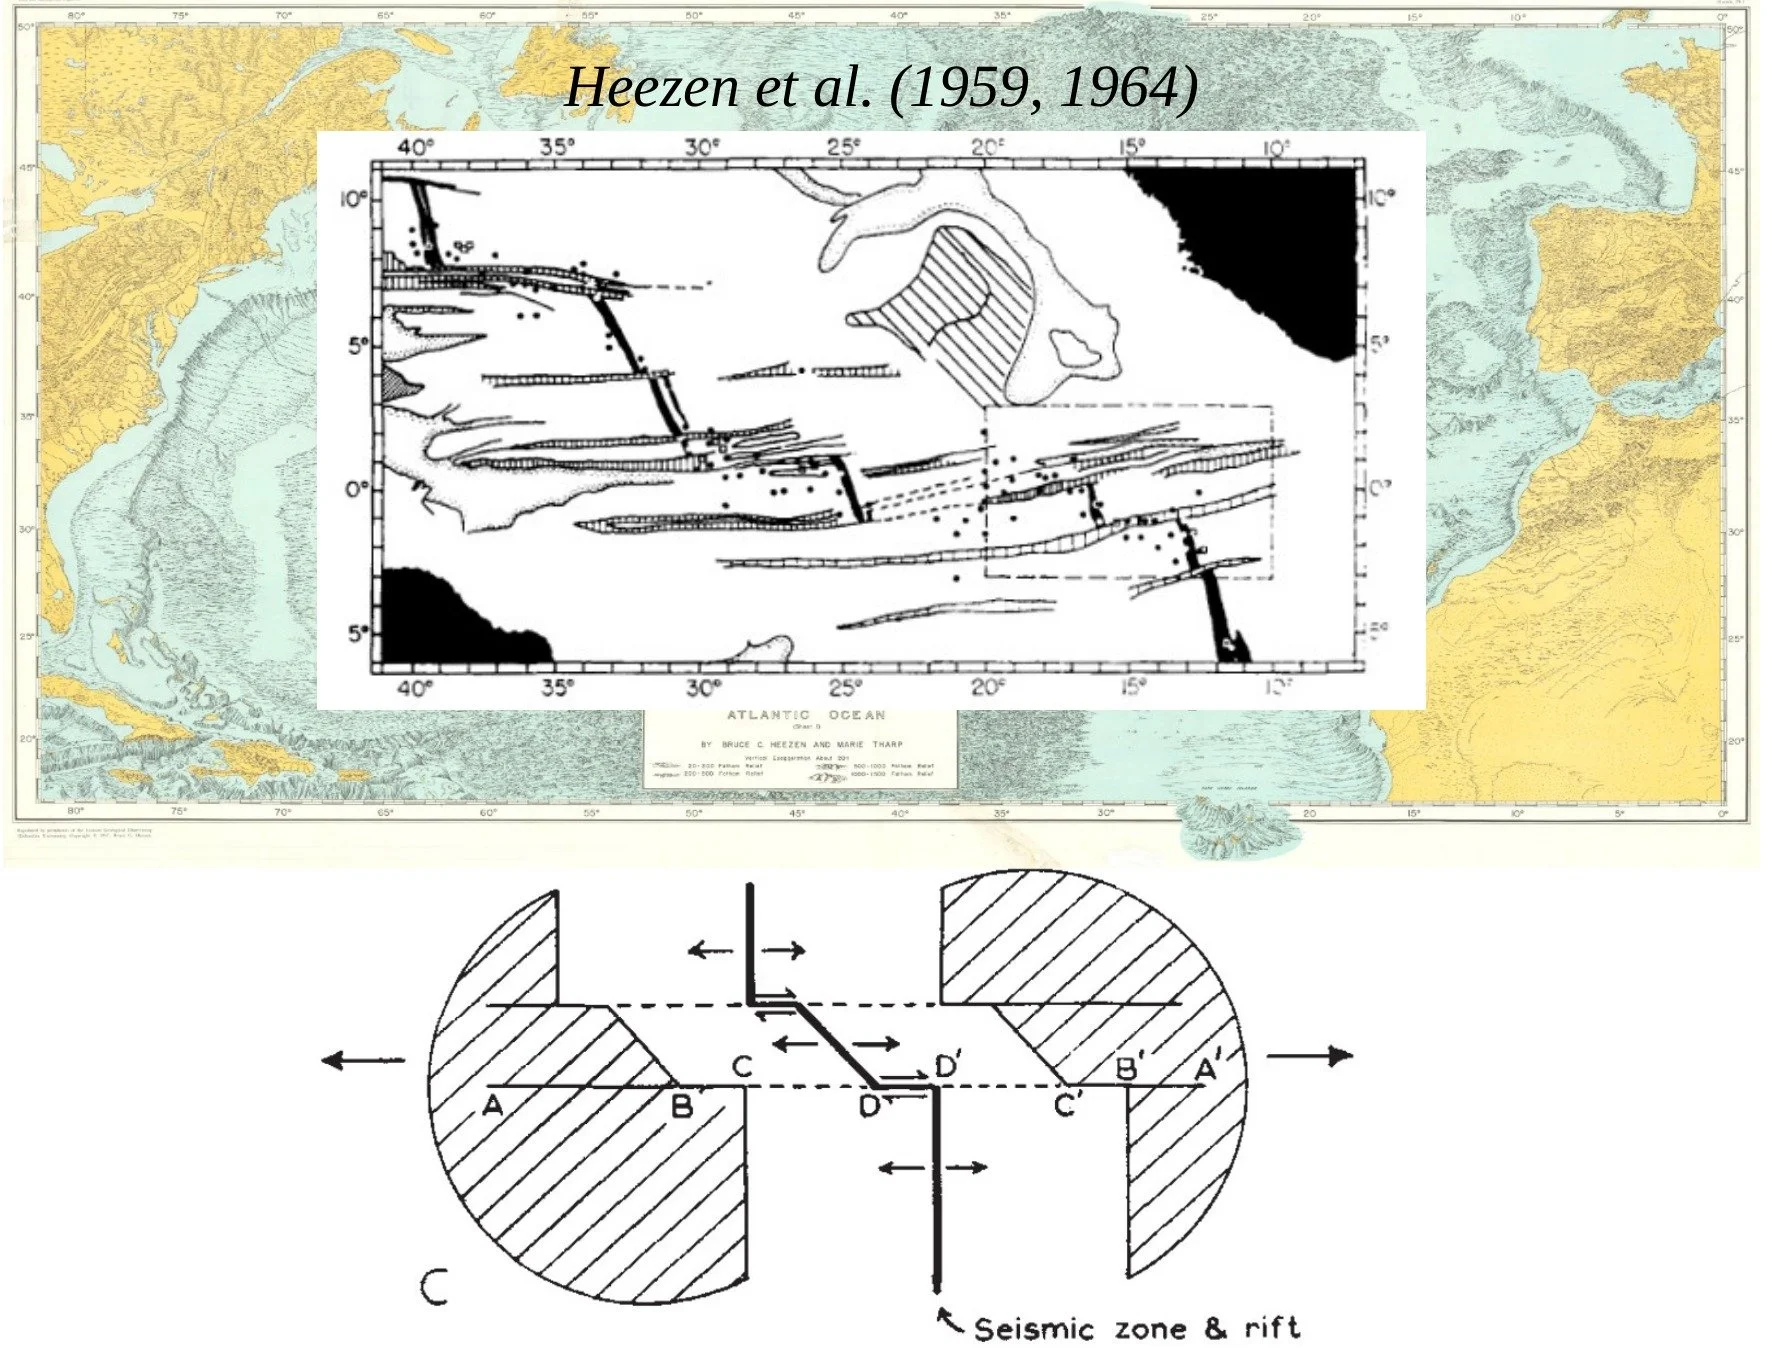
In 1965 J. Tuzo Wilson recognized a new class of faults, which he called transform faults. In his sketch (bottom), an ocean has opened between two continents (hatched) along a spreading ridge that is offset in a step. The plates slide past each other only along the fault joining the two ridge segments (heavy diagonal line), and in the opposite direction to what the offset would suggest. Behind it are Bruce Heezen’s map of the fracture zones that offset the Mid-Atlantic Ridge near the equator, and the Heezen–Tharp physiographic diagram of the Atlantic.
Wilson, J.T. (1965), Nature 207:343; Heezen, B.C., et al. (1959), Geological Society of America Special Paper 65; Heezen, B.C., et al. (1964), Deep-Sea Research 11:11
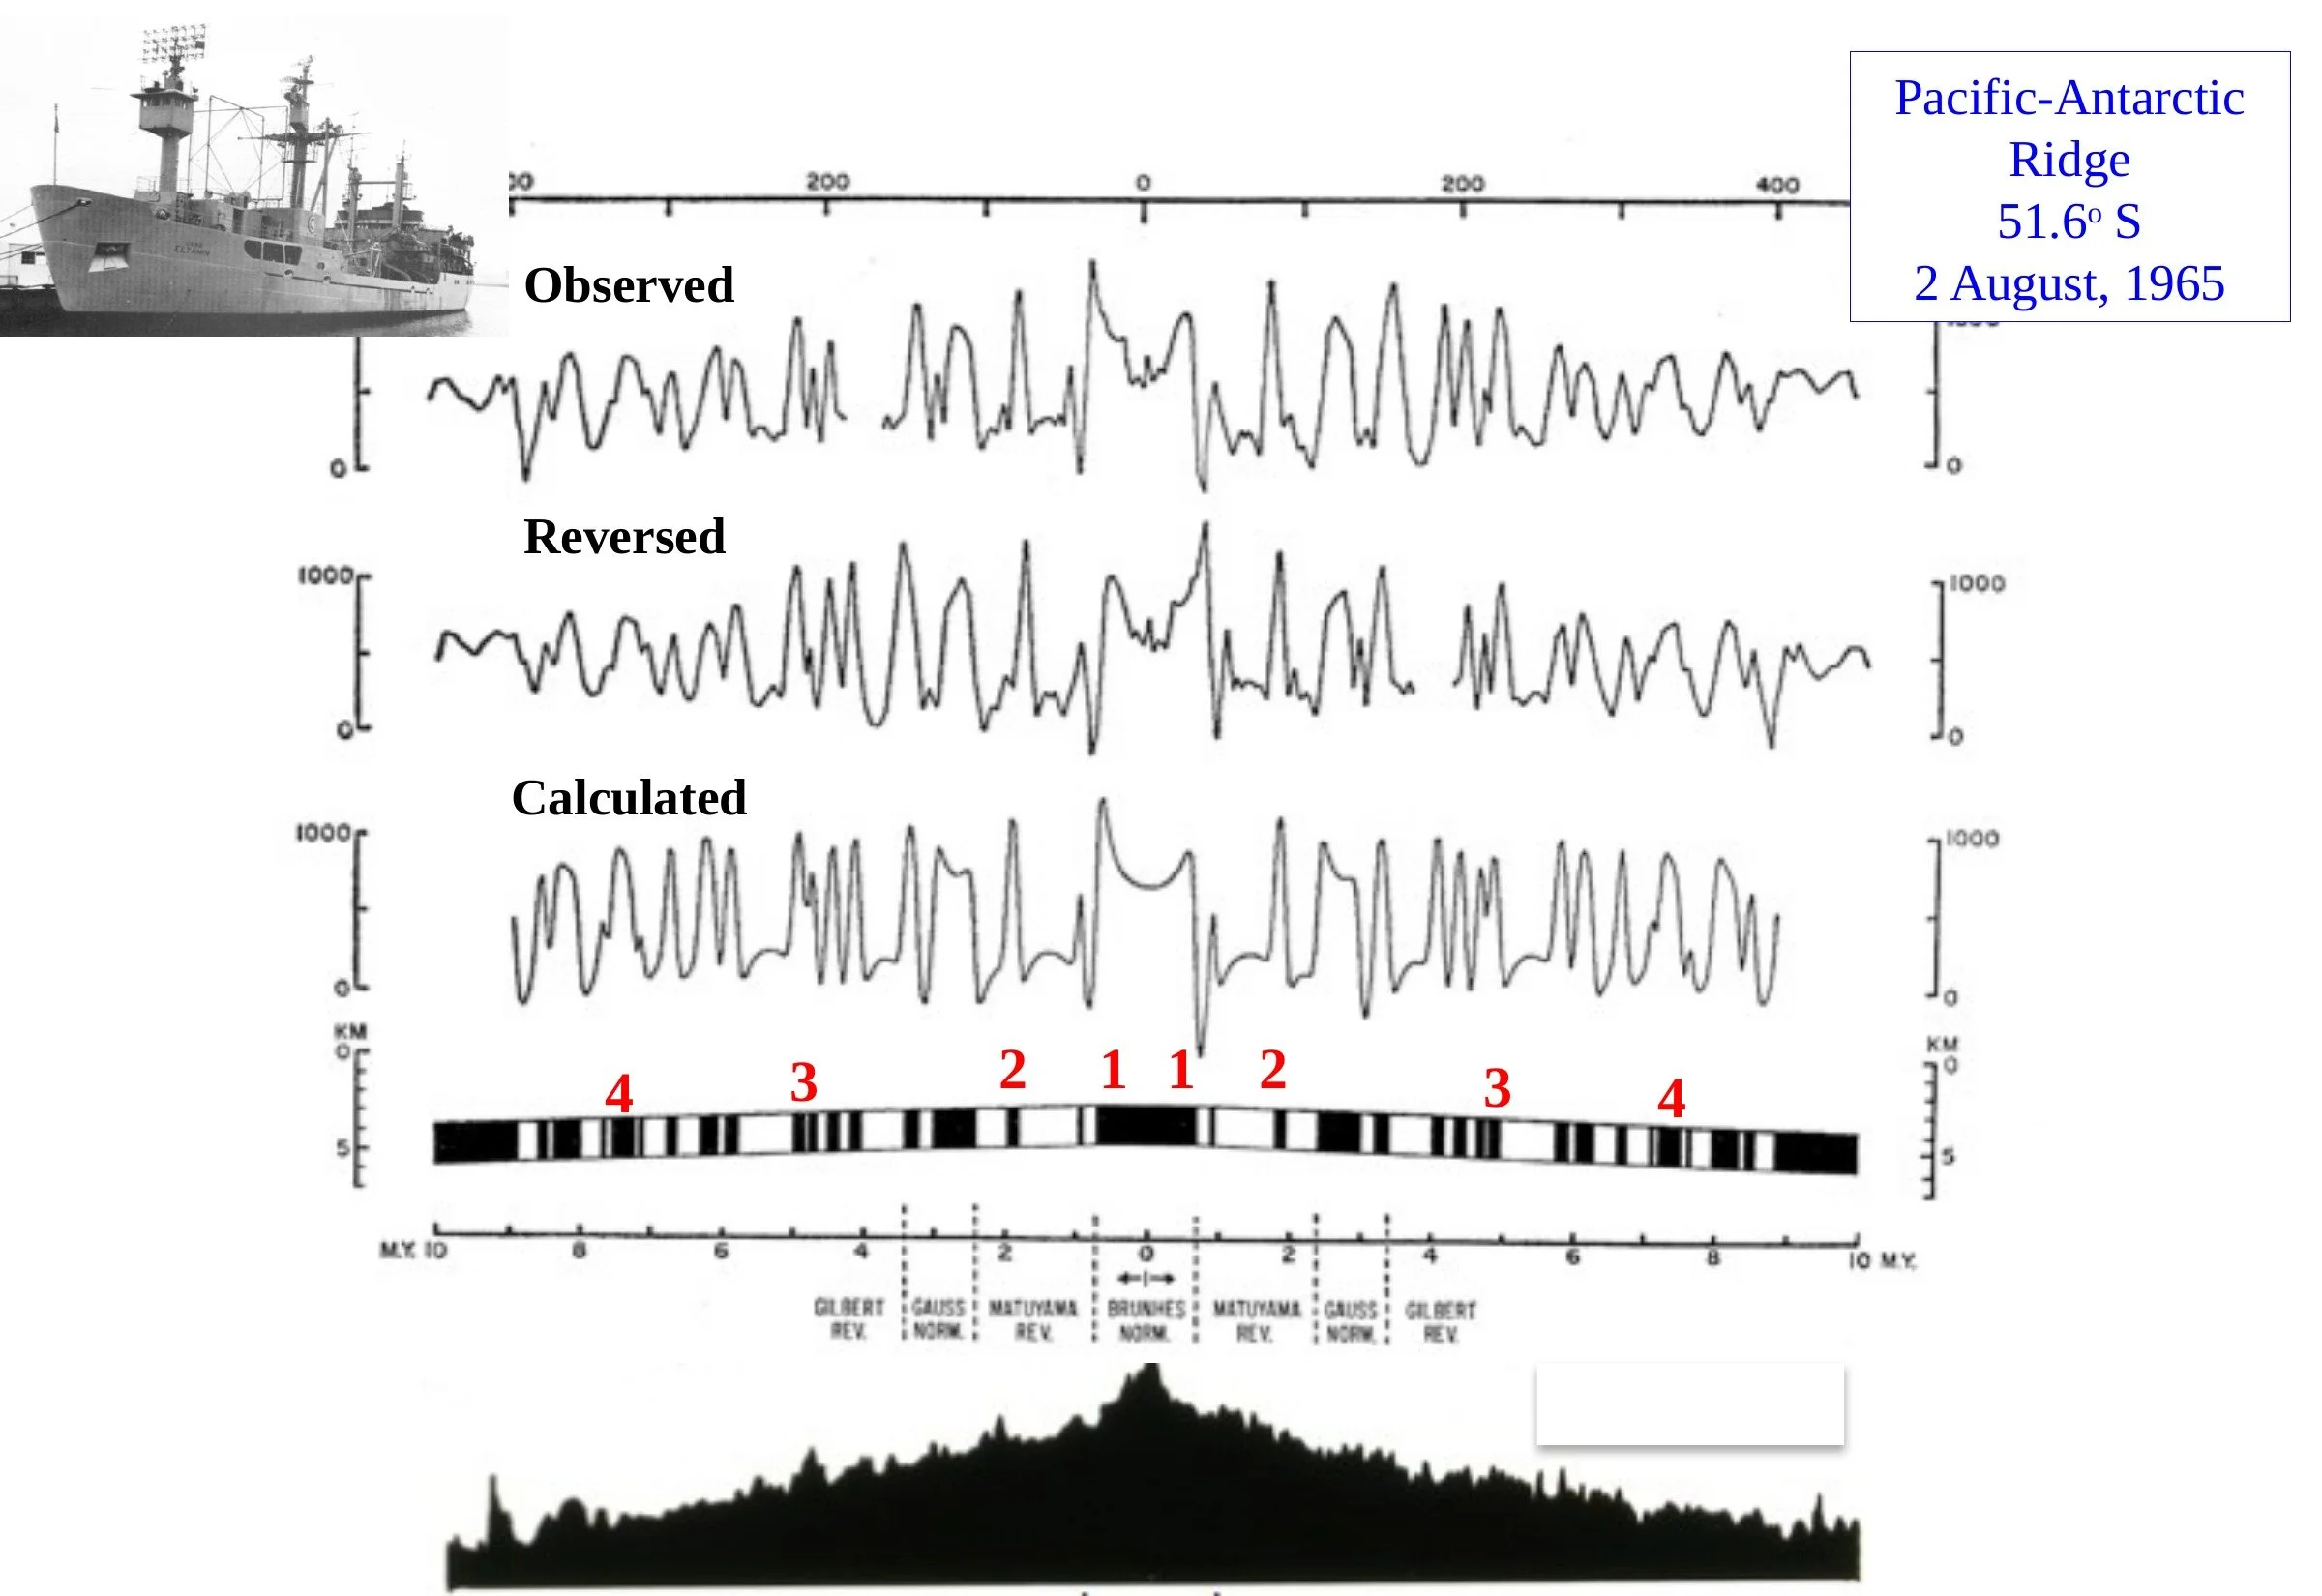
The “magic profile.” On August 2, 1965, the research ship USNS Eltanin (top left) towed a magnetometer across the Pacific–Antarctic Ridge at 51.6°S. The magnetic anomalies it recorded (top) are almost a mirror image of themselves, as the same profile reversed shows (second). The third profile was calculated for crust spreading steadily away from the ridge and magnetized in normal (black) and reversed (white) stripes as the Earth’s magnetic field flipped. Matching anomalies on either side of the ridge are numbered in red, and the seafloor topography is at the bottom.
Pitman, W.C., and Heirtzler, J.R. (1966), Science 154: 1164
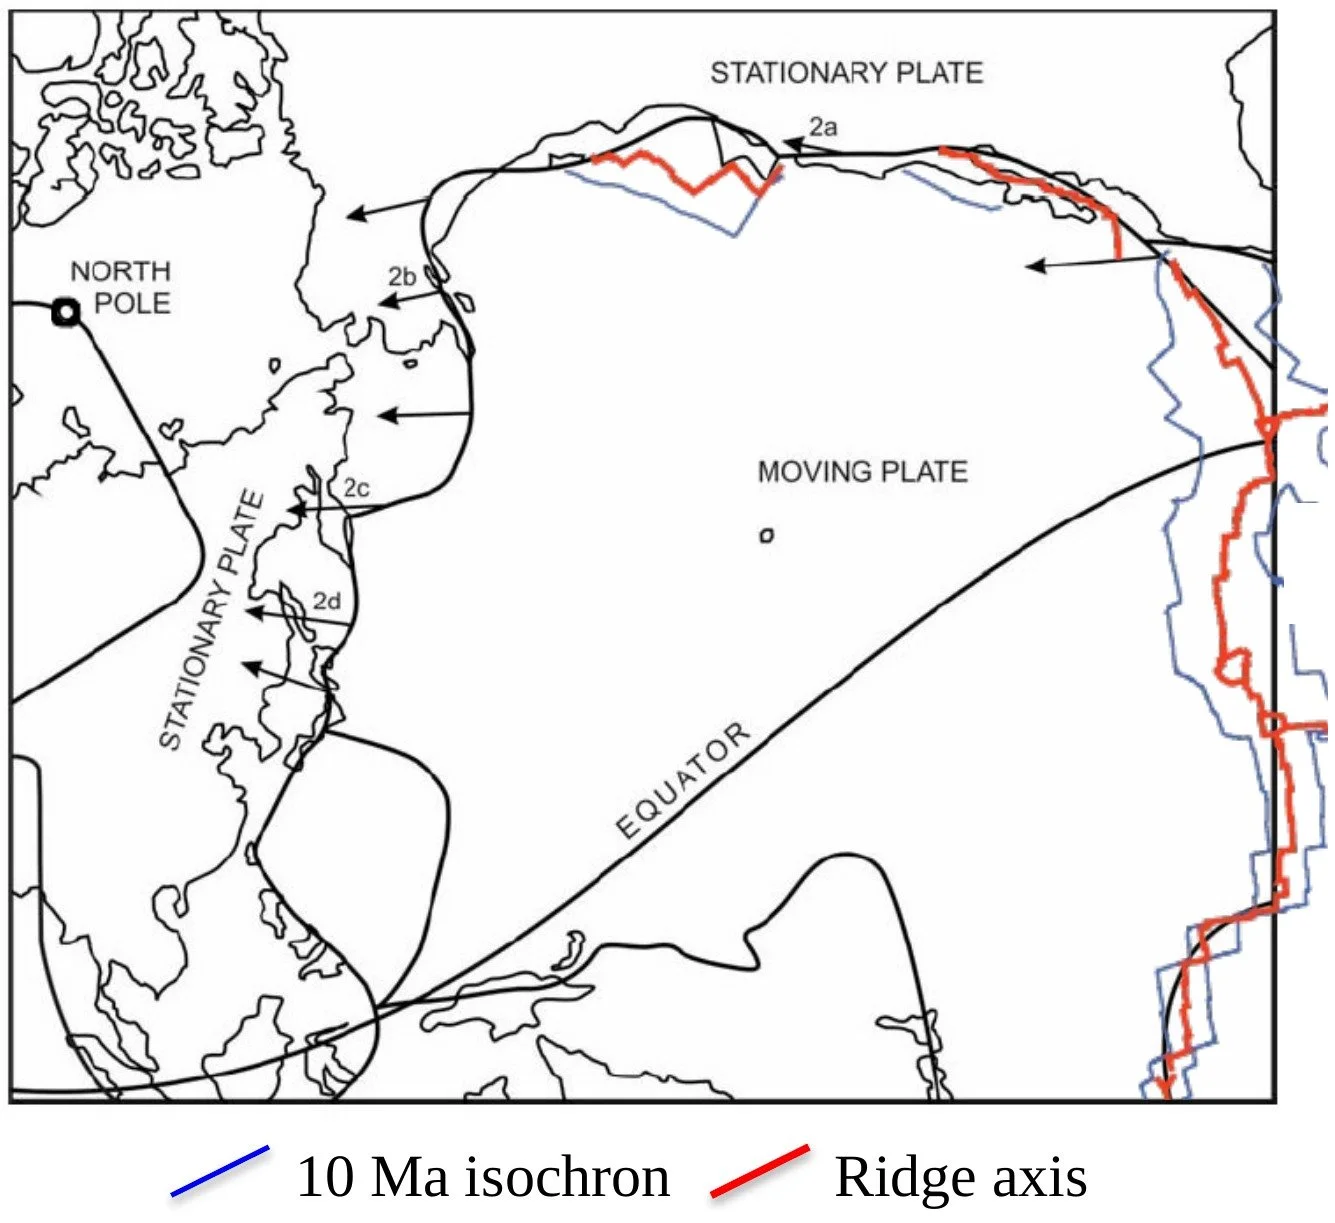
Dan McKenzie and Bob Parker’s 1967 map of the North Pacific. It uses a Mercator projection whose pole is the point, at 50°N, 85°W, about which the Pacific plate (“moving plate”) rotates relative to North America and Asia (“stationary plate”). On this projection a rigid plate should move along the horizontal lines, so the slip directions of earthquakes around the northwest Pacific (arrows) should all point the same way — and they do. The ridge axis is red. The blue lines show where the seafloor is 10 million years old, so the seafloor between them and the ridge is younger.
McKenzie, D.P., and Parker, R.L. (1967), Nature 216: 1276
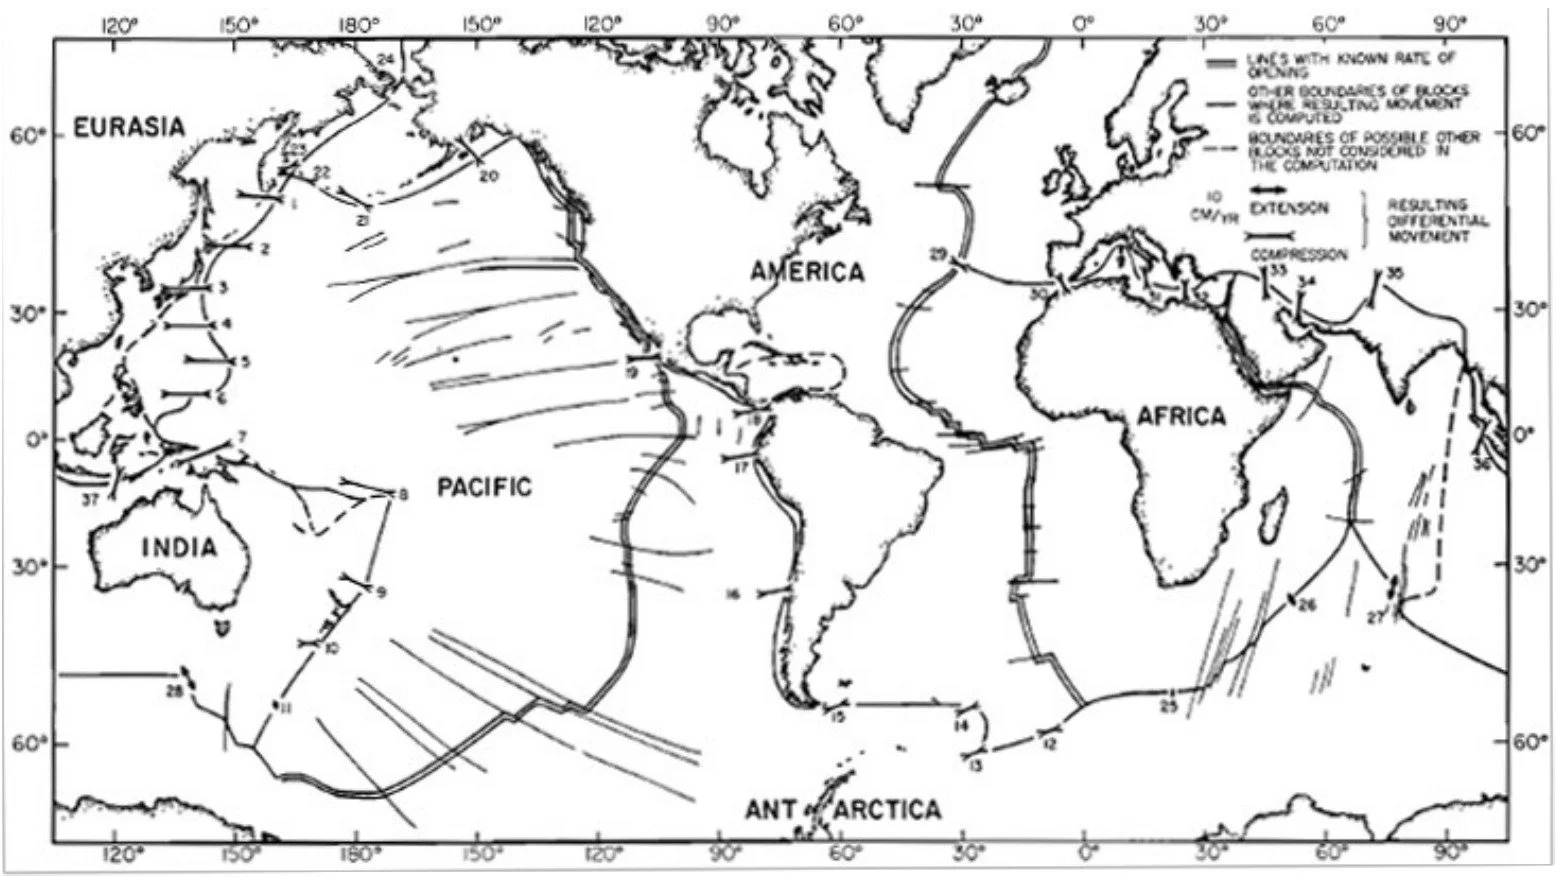
Xavier Le Pichon’s 1968 map divided the Earth’s surface into six large plates and calculated how fast they move relative to one another. Double lines are ridges whose spreading rates were known from magnetic anomalies, and arrows show the computed opening or closing at numbered points along the plate boundaries. Jason Morgan published a similar scheme the same year.
Le Pichon, X. (1968), Journal of Geophysical Research 73: 3661
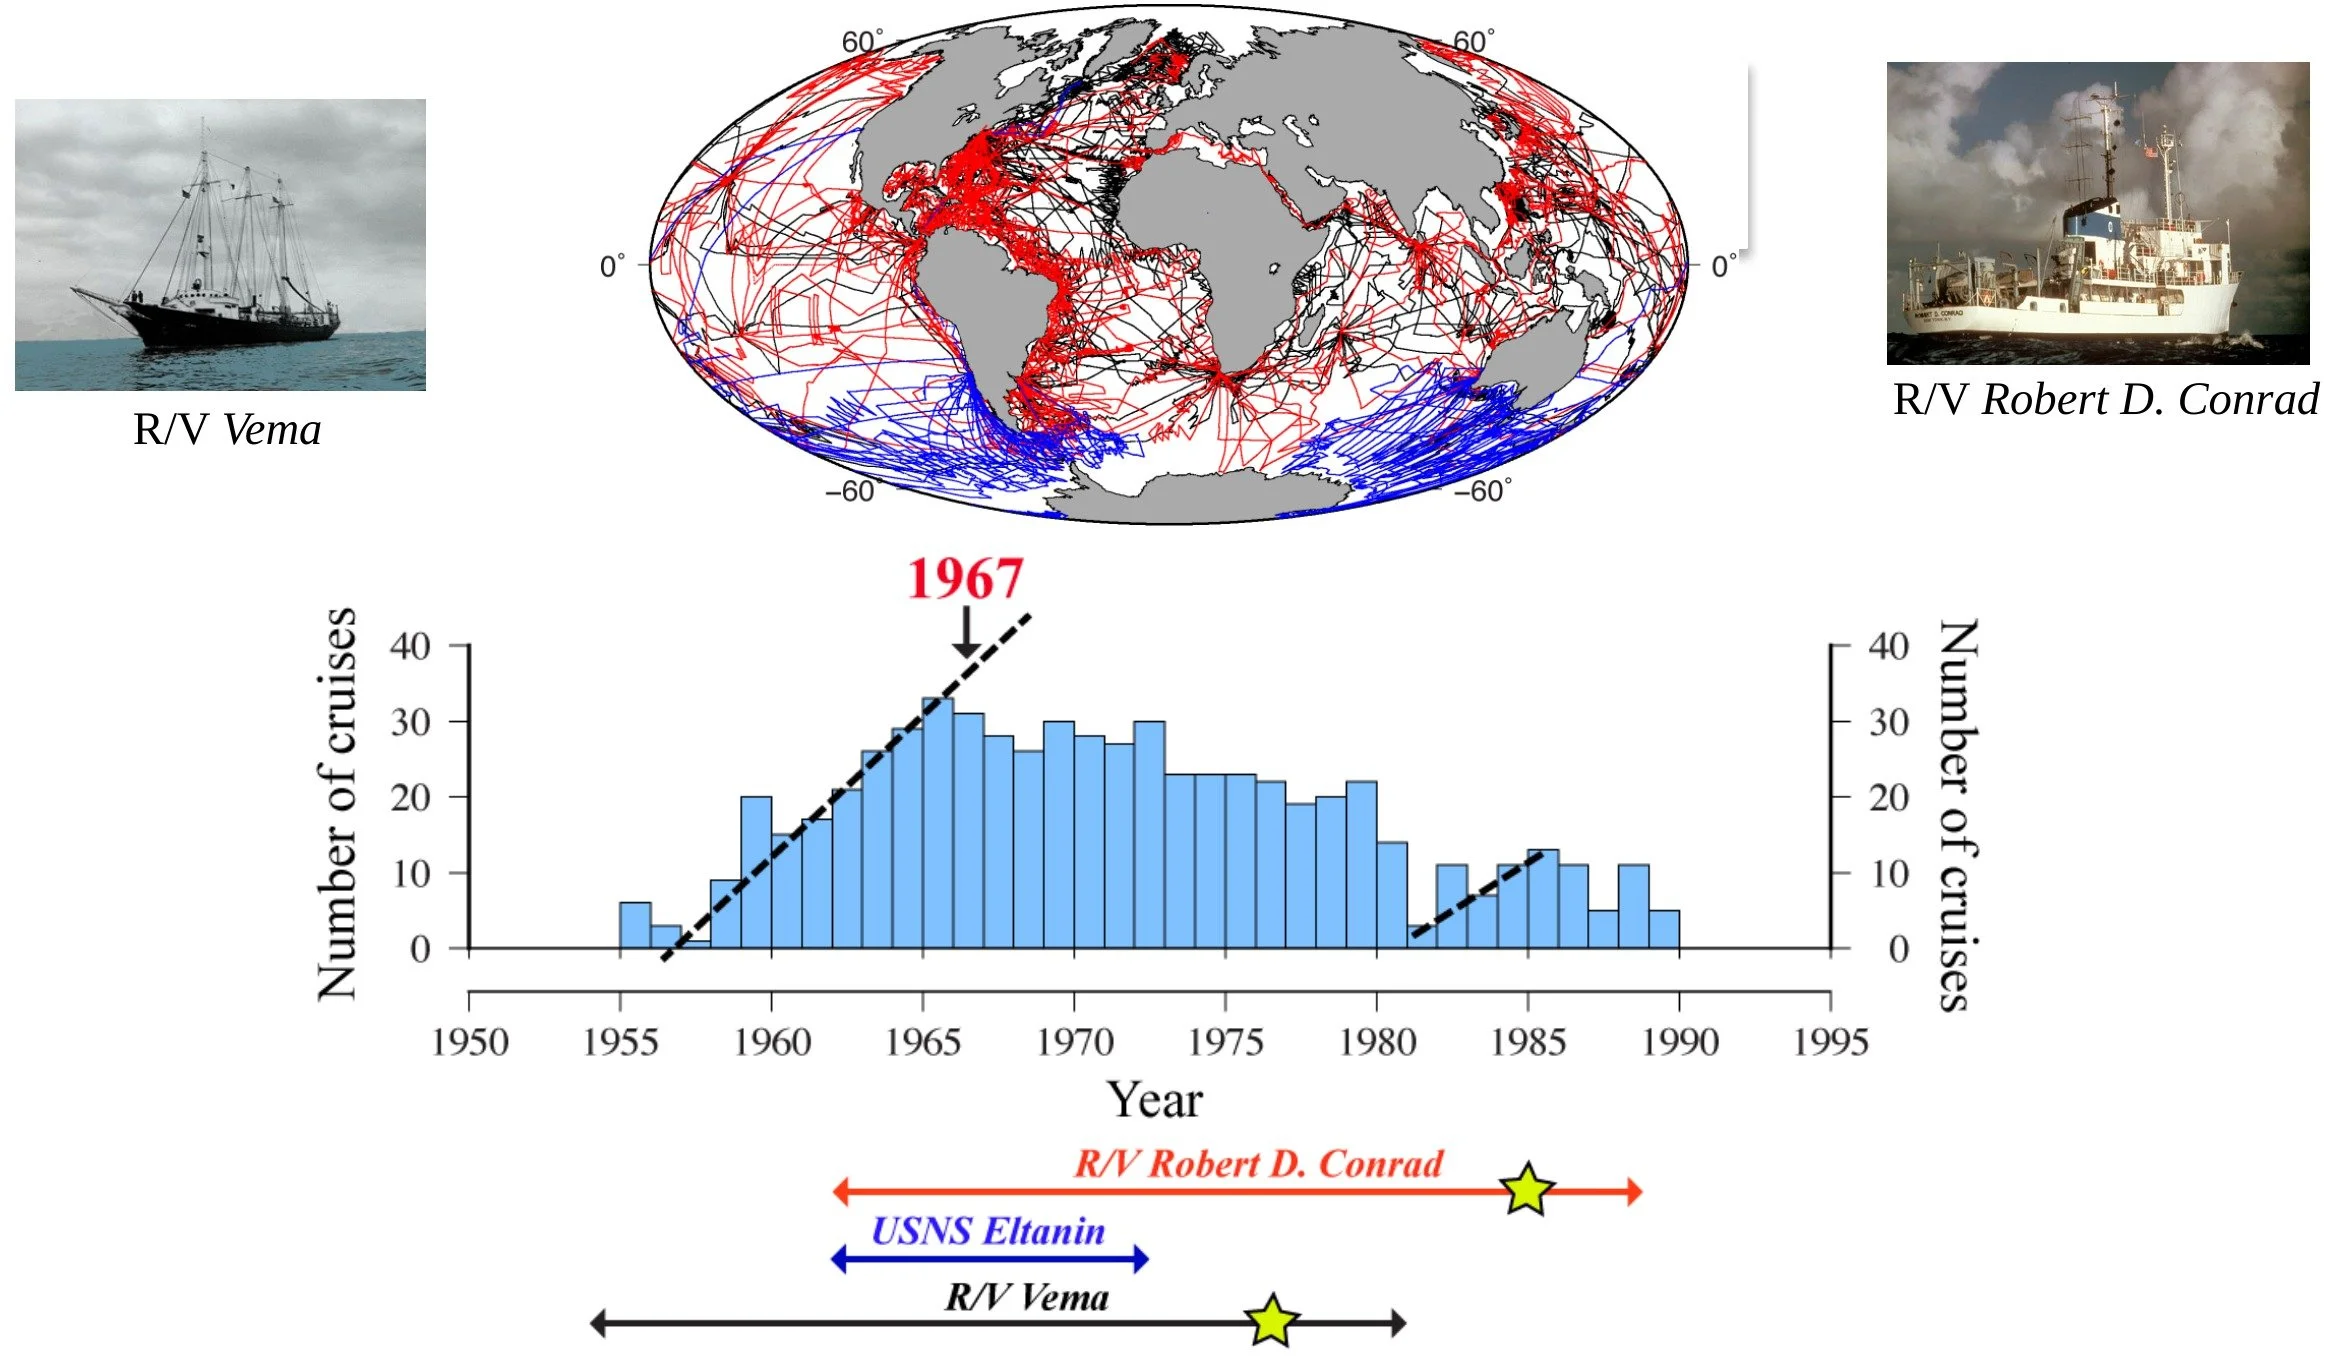
Lamont’s research fleet. R/V Vema (left) and R/V Robert D. Conrad (right), together with USNS Eltanin, sailed the tracks on the map (black, red and blue). The number of Lamont cruises a year peaked at more than 30 in the mid-1960s, and the bars below show the years each ship was at sea. When a scientist from a rival institution complained that Lamont didn’t have a proper port, its director, Maurice Ewing, replied, “You don’t collect much data when your ship is in port, tied to the dock.”
Courtesy of Tony Watts
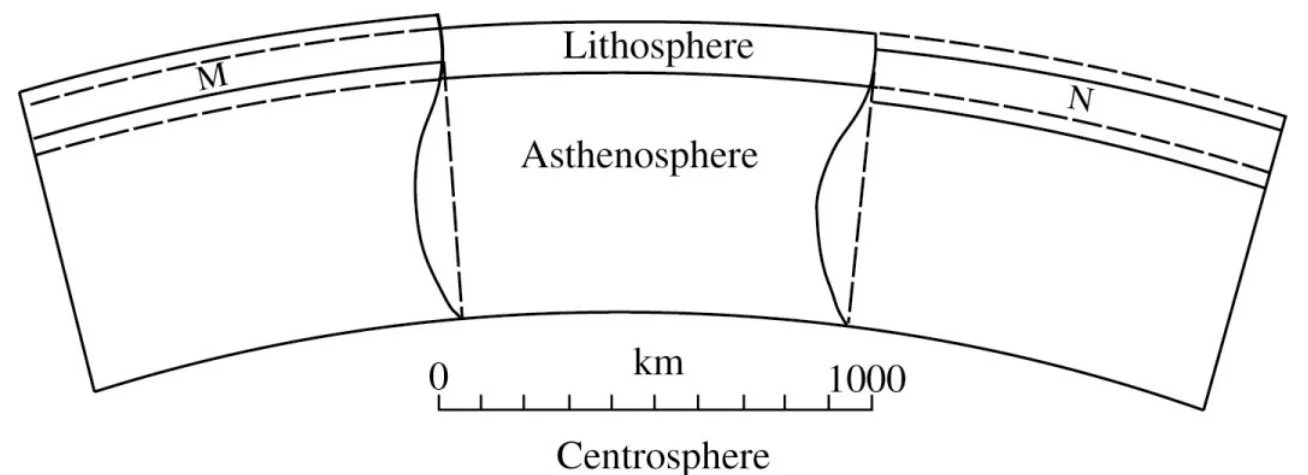
Joseph Barrell’s sketch of a strong outer shell, the lithosphere, resting on a weak layer he named the asthenosphere. Writing in 1914, he suggested that the crust “would come to act to some extent as a bending plate.”
Barrell, J. (1914), Journal of Geology 22:655
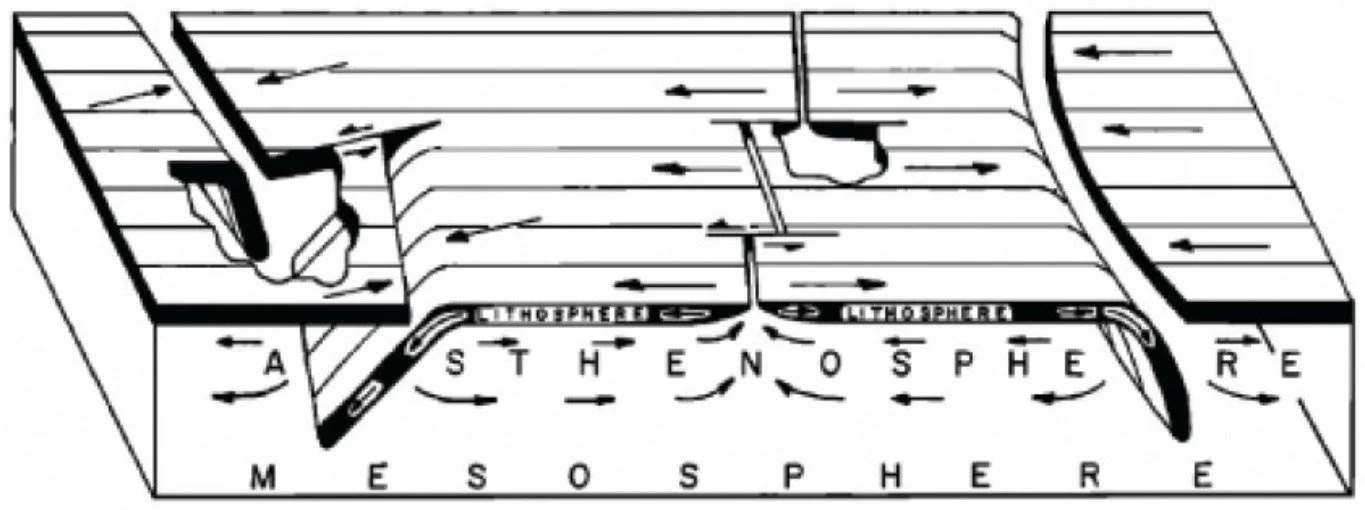
This 1968 block diagram by Bryan Isacks, Jack Oliver and Lynn Sykes, all seismologists at Lamont, became the classic picture of plate tectonics. Plates of lithosphere move apart at a ridge (center), slide past each other along transform faults, and sink into the asthenosphere at trenches (left and right). The plates are drawn as rigid slabs that bend only where they plunge into a trench, an assumption no one had yet tested.
Isacks, B., et al. (1968), Journal of Geophysical Research 73:5855
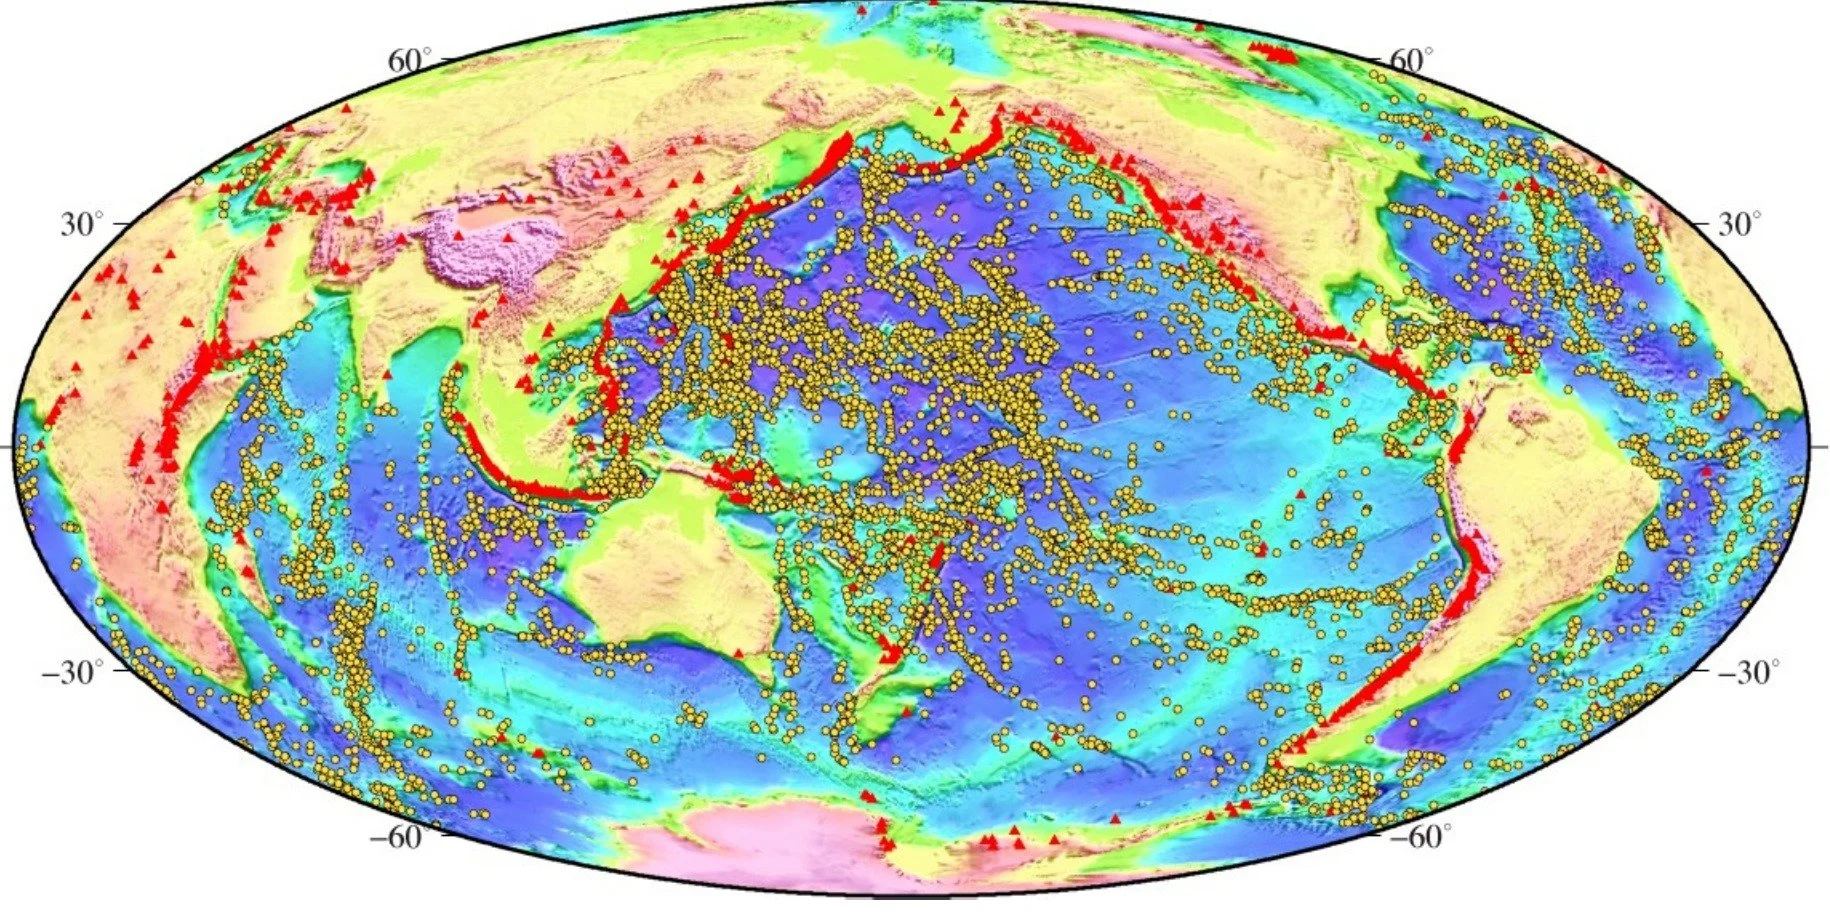
Seamounts more than 1.5 kilometers tall (yellow dots) and historically active volcanoes (red triangles). Satellite altimetry has found about 14,500 seamounts of that size, most of them in the Pacific. Each one is a load on the lithosphere that bends the plate beneath it.
Courtesy of Tony Watts