
Vic Baker on Megafloods
Listen here or wherever you get your podcasts.
Vic Baker has been studying megafloods for over 50 years. He is a Professor of Hydrology and Atmospheric Sciences, Geosciences, and Planetary Sciences at the University of Arizona.

Podcast Illustrations
Images courtesy of Vic Baker unless otherwise indicated.
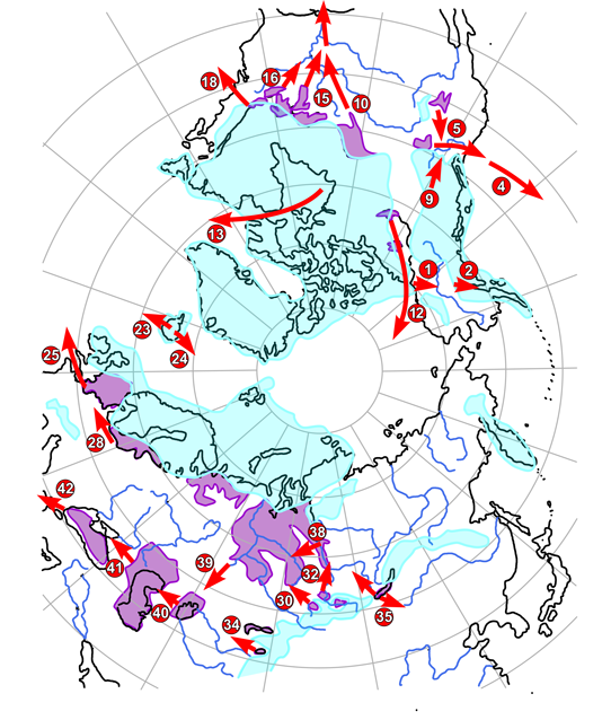

Megaflood pathways during the Pleistocene ice ages.


Phases of erosion of a scabland flood channel by macroturbulent eddies called “kolks.” These are set up by flow obstructions. The intense pressure and velocity gradients of the vortex produce hydraulic lift that can lift up large boulders. The Pre-Wisconsin Loess refers to wind-blown deposits formed before the Wisconsonian, which was the last major ice age in North America, lasting from about 75,000 to 11,000 years ago.

Rock basins eroded into Columbia River Basalt at Lenore canyon, Lower Grand Coulee in the Channeled Scabland of Eastern Washington. Note the roads for scale.
Natural bridge separating rock basins eroded into fractured basalt bedrock by the plucking action of macroturbulent eddies.


Flow velocities obtained from computer-based modeling of flows about 20,000 years ago in what is now the state of Washington. In the red areas, flow velocities exceeded 20 meters per second. As shown in the graph below, for low depths (less than about 20 m) cavitation will only occur when velocities exceed about 10 meters per second or so. The critical velocity for cavitation initiation increases rapidly with flow depth. Nevertheless, since some megaflood flow velocities reached 30 or 40 meters per second, cavitation could have occurred even for flow depths of 100 meters or more.
Whereas river floods may reach depths of no more than a few 10s of meters and mean flow velocities of a few meters per second, high-energy mega-flooding can reach depths exceeding 100 meters and velocities of 10s of meters per second. The green points correspond to flows inferred from the scabland channels. Exceptionally high velocities lower the water pressure so much that cavitation can be reached in the flow (red line). This can produce dramatic erosion of bedrock. The F = 1.0 line in the figure is for a Froude Number of 1.0. The Froude number is a ratio between inertial and gravitation factors in flowing water. These are equal at the transition from subcritical (tranquil or deep, slow flow) to supercritical (shooting or rapid, shallow flow).


Giant current ripples at West Bar, near Trinidad, Washington.
About 5.3 million years ago, the Mediterranean basin was dry. As global sea level rose, waters from the Atlantic filled the Western basin through the modern-day Strait of Gibraltar (A). Erosion features on the seafloor suggest that the flooding occurred abruptly during a period estimated to have lasted between several months and two years. In a later flooding phase, the eastern Mediterranean filled abruptly when a barrier dividing the west basin from the east basin between Sicily and Tunisia (F) was breached.

Mars

Map of Mars showing major water flow channels in red. Blue areas: mainly the northern plains of the planet, which constituted a temporary sea called Oceanus Borealis, and some local areas of ponded water, such as the Argyre impact basin and Valles Marineris. Pink areas: local accumulations of sediments delivered from outflow channels to the northern plains. Beige areas: the heavily cratered southern highlands of Mars and other highlands produced by concentrated volcanism. Most of the largest outflow channel activity that formed the general relationships shown in the map occurred about 3 billion years ago.
Map view (right) and topography (below right) of the Kasei Vallis megaflood channel. Kasei Vallis is the largest of the Martian outflow channels, about 3,000 km long and up to as much as 400 km wide in the areas shown at right.


Mega-flood flow discharges are calculated by combining the channel cross-sectional areas (left) with velocities determined from the slopes of the water surfaces along the flood channelways (below). Because the flows occur on such an immense scale and have such a great effect on the landscape, the high-water evidence is exceptionally well preserved and can be used to determine megaflood flow volumes and energies.
The megaflood channel cross sections illustrated here are all in Washington State.

Flood-transported boulders in the Ephrata Fan, Channeled Scabland, Washington.


Until about 425,000 years ago, Great Britain was joined to Europe by a narrow isthmus along the Weald-Artois anticline, a fold consisting of the Cretaceous chalk that is today cut at the cliffs of Dover in England and the Cap Blanc Nez near Calais in France. As Baker discusses in the podcast, a large glacial lake formed south of an ice cap spanning northern Britain and Scandinavia. This lake eventually breached the isthmus, resulting in a megaflood that eroded what is now the seafloor below the English Channel into a steep-sided inner channel and plunge pools.
Imperial College London, Sanjeev Gupta and Jenny Collier

Topography of Mars showing the Kasei outflow channels in the lower right, with flow directed to the northern plains, where the Oceanus Borealis formed.
Baker, V.R., et al. (2015), Geomorphology 245, 149
Relative sizes of flood channelways. The top two are Martian megaflood channels. The Manych spillway connected the ancient Caspian to what is now the Black Sea. The Altai was a megaflood landscape in central Asia. The numbers refer to the peak discharges in cubic meters per second. The vertical scale is greatly exaggerated.