
Bernhard Steinberger on Whether Hot Spots Are Fixed
Listen here or wherever you get your podcasts.

Volcanic island chains like Hawaii record the passage of a plate over a hotspot — a plume of hot rock rising from deep within the mantle. For decades, hotspots were assumed to be fixed, providing a stationary frame of reference against which we could measure the absolute motions of the plates. But are they really fixed? And what would that even mean — fixed relative to what? In the podcast, Bernhard Steinberger explains how we can combine paleomagnetic measurements, hotspot tracks, and relative plate motions to answer these questions, and how his own modeling of mantle flow showed that plumes are blown about by the very currents they rise through.
Steinberger is a Geophysicist at the GFZ Helmholtz Centre for Geosciences in Potsdam.
World Map of Hotspots
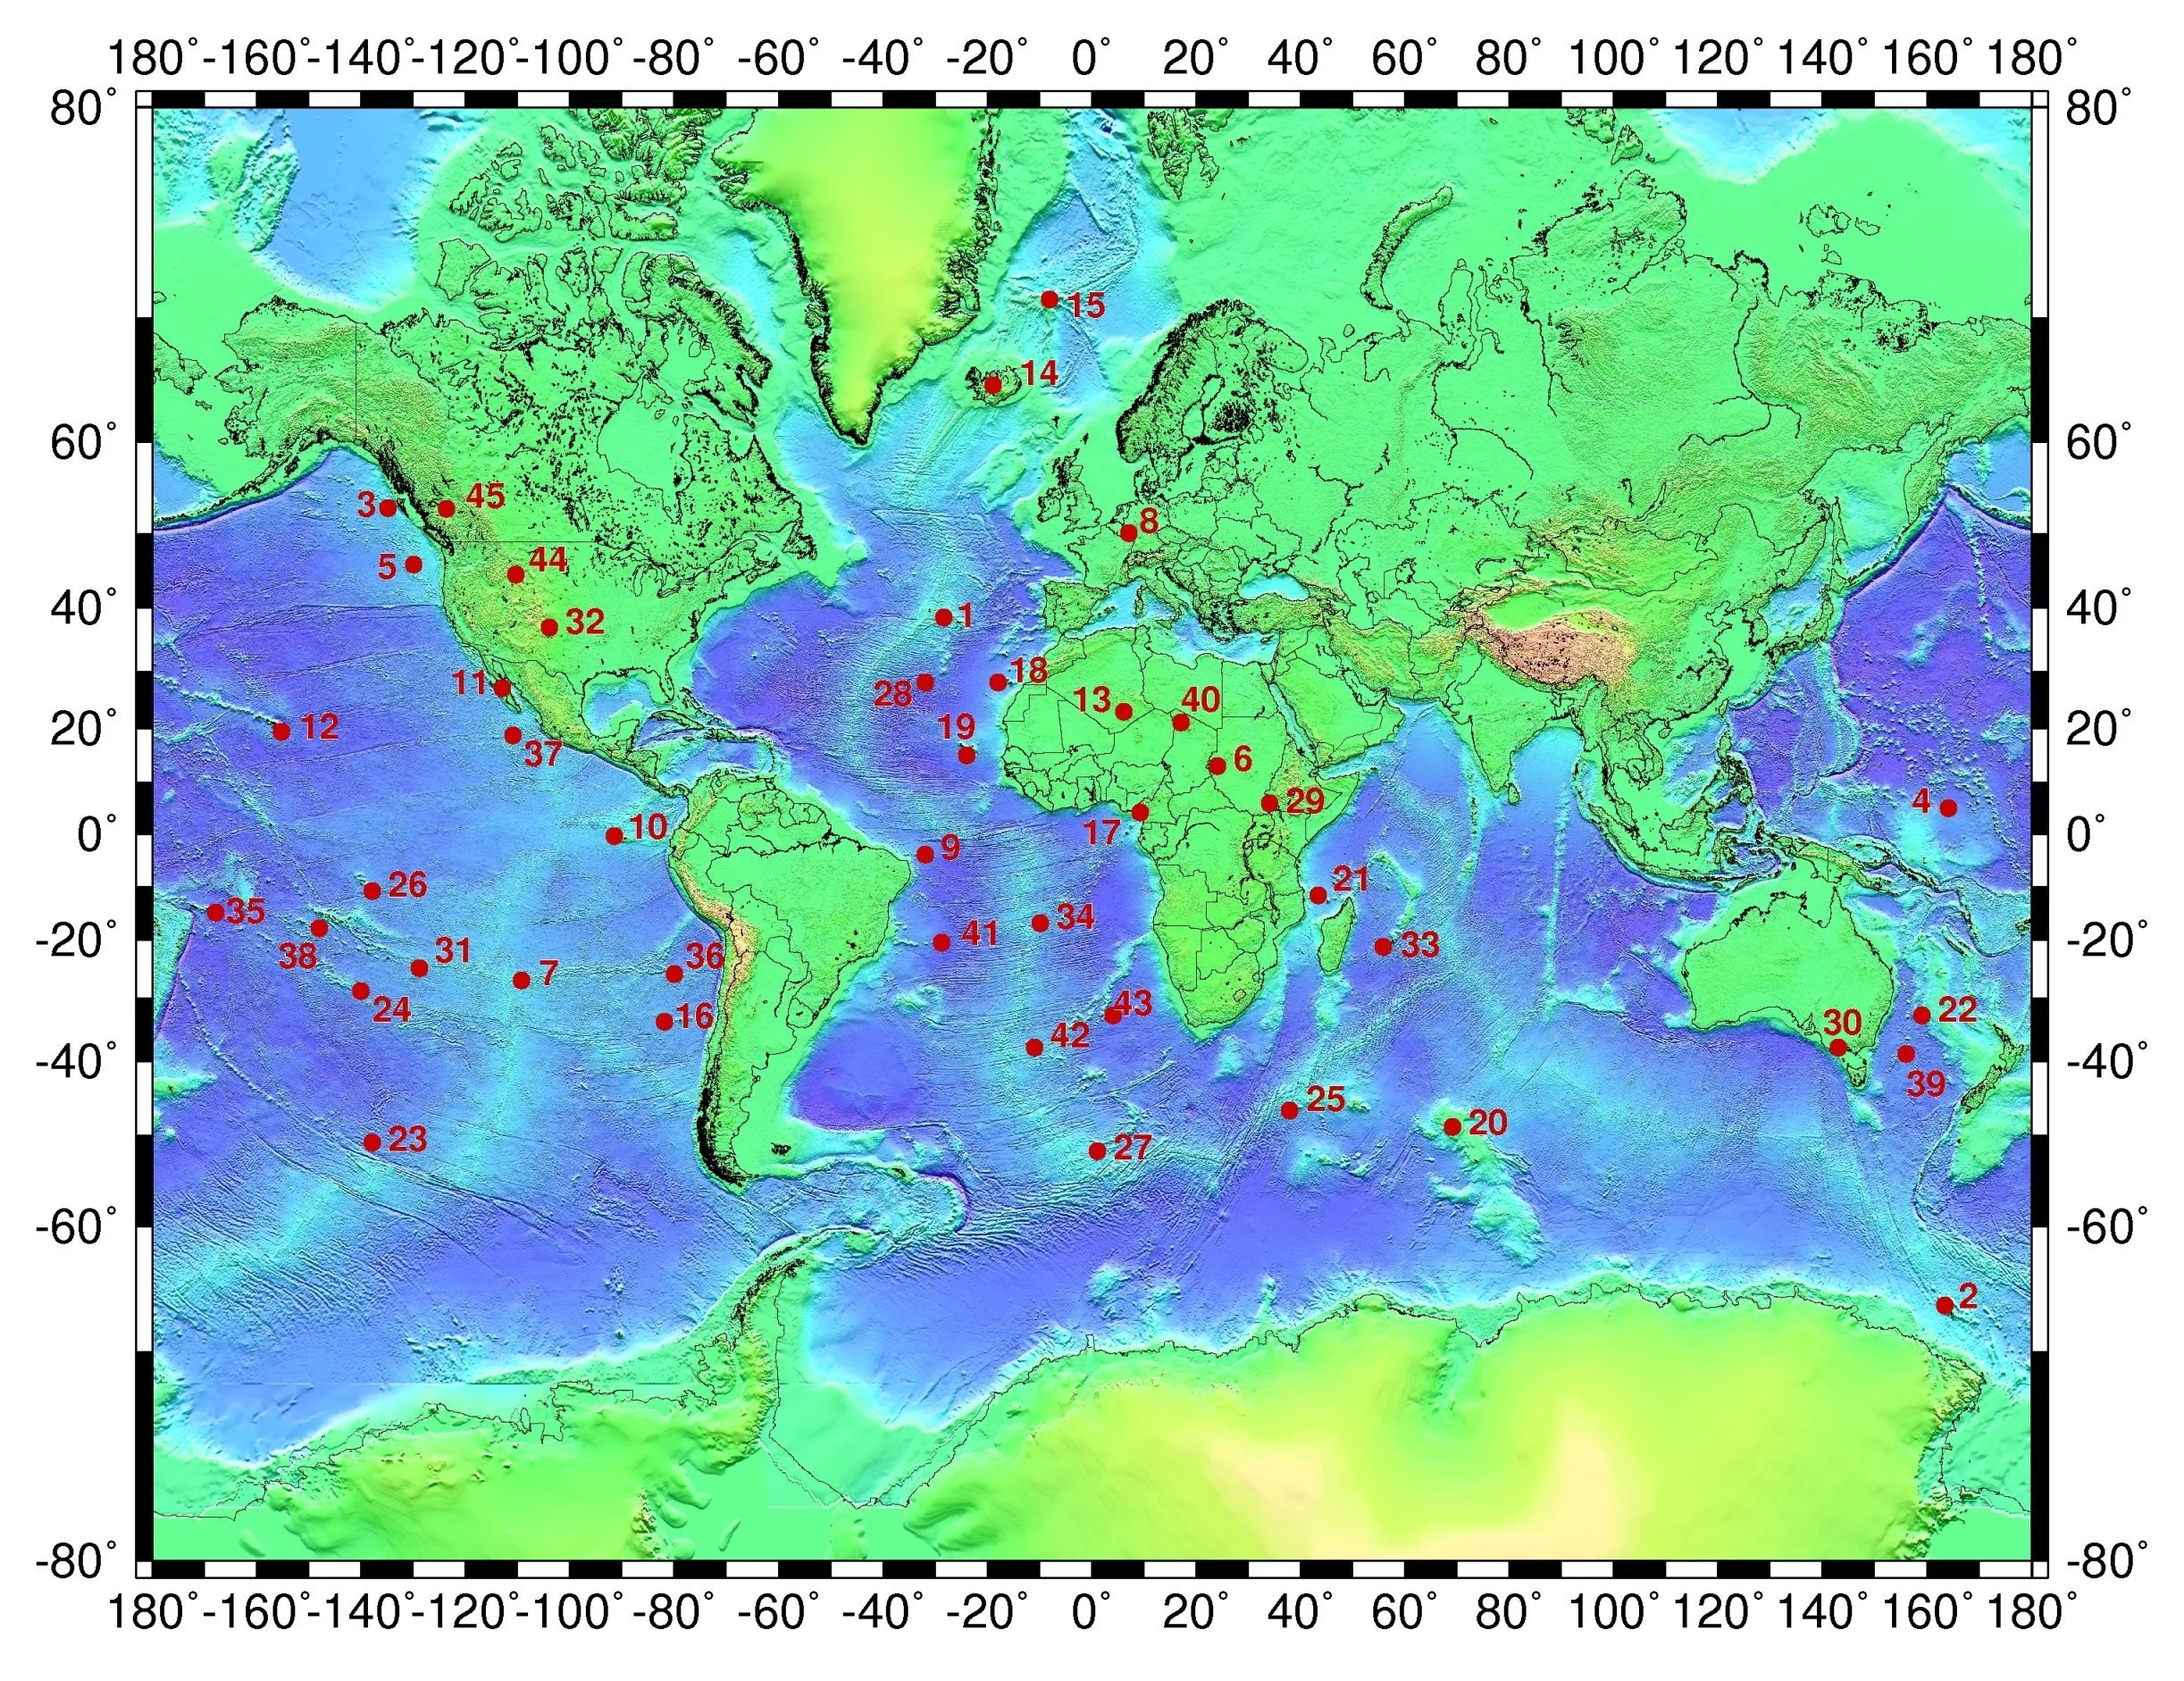
The major hotspots of the world. They occur both within plate interiors and on or near mid-ocean ridges, and the tracks they have produced range in age from under 10 million years to more than 200 million. Several feature in the podcast: Hawaii (12), whose track — the Hawaiian–Emperor seamount chain — is discussed through the whole conversation; Louisville (23), its South Pacific counterpart on the same plate; and Réunion (33), the Canary Islands (18), and Iceland (14), around which arrays of ocean-bottom seismometers have been, or are about to be, deployed in the hope of imaging the plume conduits directly. Additional hotspots that appear among the modeled hotspot motions shown further down the page are: Tristan da Cunha (42), Kerguelen (20), and Réunion (33). Numbering is based on the alphabetic hotspot list on https://de.wikipedia.org/wiki/Liste_identifizierter_Hot_Spots
Map from Wikipedia, largely based on the hotspot compilation of Steinberger (2000)
Modeling the Formation of Plumes
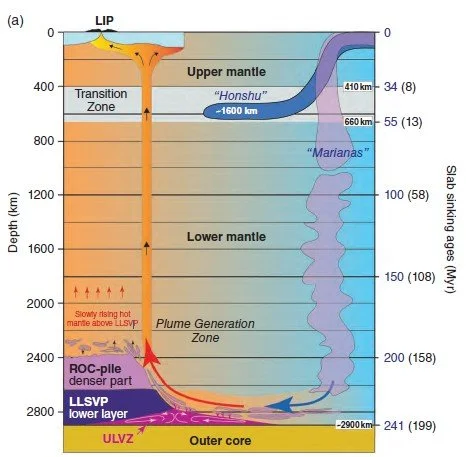
Schematic representation of the mantle suggesting that plumes are anchored to the large low shear-wave velocity provinces (LLSVPs) — vast, dense thermochemical piles sitting on the core–mantle boundary beneath Africa and the Pacific. Subducted slabs sink through the mantle — some, like the Marianas slab, plunging straight through the mantle transition zone, others, like the Honshu slab, flattening and stagnating on the way — and take around 200 million years to reach the bottom. As they arrive, they bulldoze hot material at the base of the mantle ahead of them until they reach a LLSVP. There, at the "plume generation zone" along the pile's margin, the displaced hot material is forced upward and can begin to rise as a mantle plume. Because the plumes are rooted in the sluggish lowermost mantle, the hotspots they feed are relatively — but, as Steinberger explains in the podcast, not absolutely — fixed. The figure shows the plume erupting at the surface (top left) and contributing to a large igneous province (LIP). How long the ascent lasts is uncertain as it depends on the poorly constrained lower mantle viscosity. ROC: recycled oceanic crust; ULVZ: ultra-low velocity zone.
Torsvik et al. (2021), AGU Geophysical Monograph 263
Modeling Plume Motion in a Mantle Advection Flow
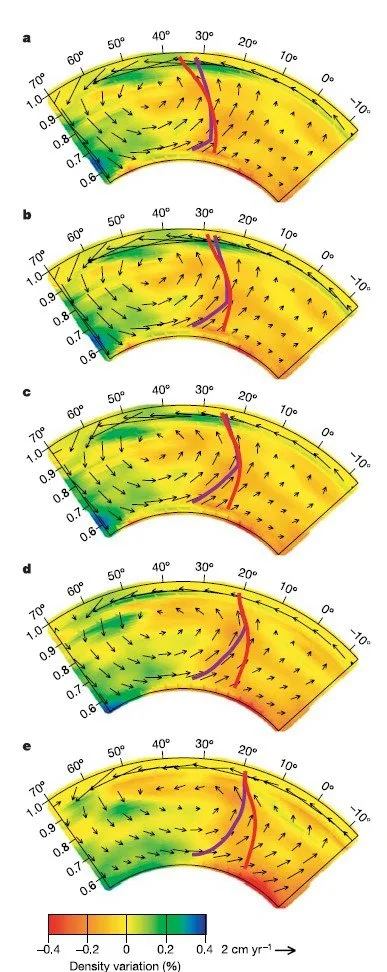
As Steinberger explains in the podcast, it is the relative motion of a plate with respect to a hotspot that is recorded by its track of volcanos and seamounts. This relative motion is the difference between the plate’s motion with respect to the mantle and the hotspot’s motion with respect to the mantle. Steinberger and his colleagues modeled global mantle flow to determine how this would affect the path of hotspot plumes. Each panel in the figure is a north–south cross-section through the mantle beneath the Pacific at the longitude of Hawaii, at times from 120 million years ago (top) to the present (bottom). The rainbow colors show density anomalies inferred from seismic tomography; the arrows show the computed mantle flow. The figures also show the projection of the predicted Hawaiian plume conduit for a source moving with the flow (red line) and a fixed source (violet line). The conduit ascends buoyantly while being carried sideways by the currents it rises through — here, northward flow in the upper mantle and southward flow in the lower mantle. For the Hawaiian hotspot, the model results suggest a moderately slow southward movement of about 1 cm/yr but with episodes of fast motion (several cm/yr).
Steinberger, Sutherland & O'Connell (2004), Nature, 430, 167–173
What We Can Actually Measure
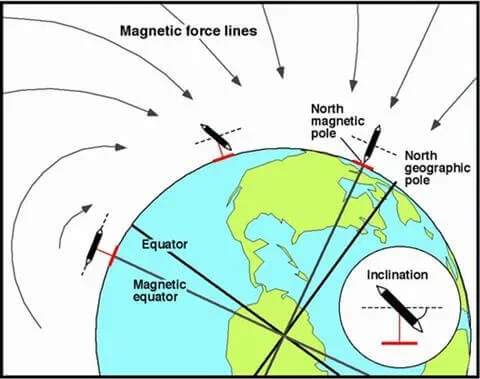
The Earth's magnetic field lines emerge steeply from the ground near the poles and run parallel to the surface at the magnetic equator. A freely suspended compass needle therefore dips at an angle — the inclination — that depends on latitude: horizontal at the equator, vertical at the pole. When lava cools, it locks in the direction of the local field, inclination included, and carries it through geological time.
Diagram from pmfias.com
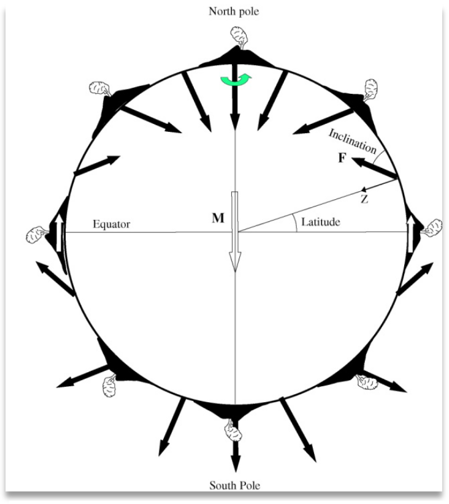
From inclination to paleolatitude. What is actually measured in an ancient lava is the inclination I of its frozen-in magnetization. On the assumption that the Earth's field, averaged over a sufficiently long time, is a dipole aligned with the spin axis, the inclination converts directly into the latitude λ at which the rock was magnetized, through the relation tan I = 2 tan λ. As Steinberger explains in the podcast, one needs to measure many lava flows to average out the field's shorter-term fluctuations. Inclination reveals only latitude — paleomagnetism is blind to east–west motion.
Torsvik, T.H. et al., Gplates Paleomagnetism Tutorial
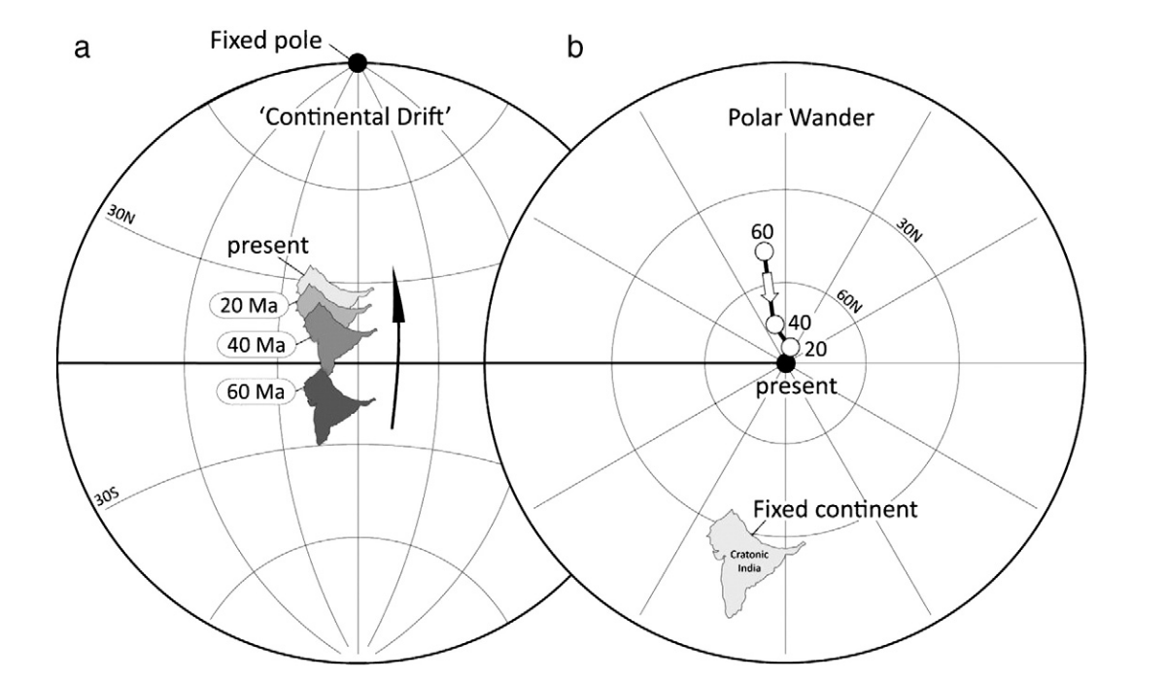
(a) Successive paleolatitude measurements from rocks of different ages on a single continent trace out an "apparent polar wander path" — the pole appears to migrate across the globe through geological time. Of course, the pole itself has stayed put (to first order); it is the continent that has moved relative to it. An apparent polar wander path is therefore a record of a plate's motion relative to the Earth's spin axis (b), and every continent has its own.
Torsvik, T. H. et al. (2012), Earth Science Reviews, 114, 325
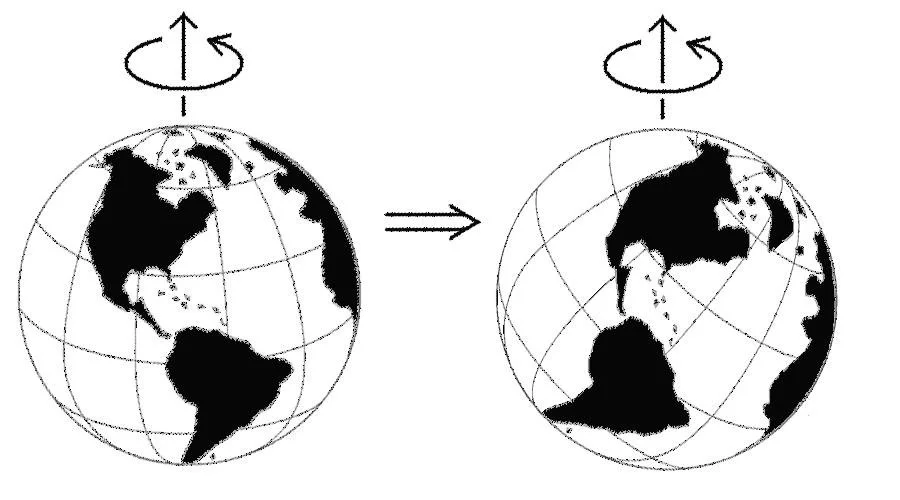
True Polar Wander
As mass shifts around inside the Earth — slabs sinking, plumes rising — the whole solid Earth, mantle and crust together, slowly reorients itself relative to the spin axis so as to keep its maximum moment of inertia aligned with the axis. Seen from the surface, every point on the globe changes latitude in the same synchronized way. This global signal is embedded in all paleomagnetic data, and it needs to be separated from the individual motions of plates and hotspots in order to determine plate motions relative to the deep mantle.
Diagram from Wikimedia Commons
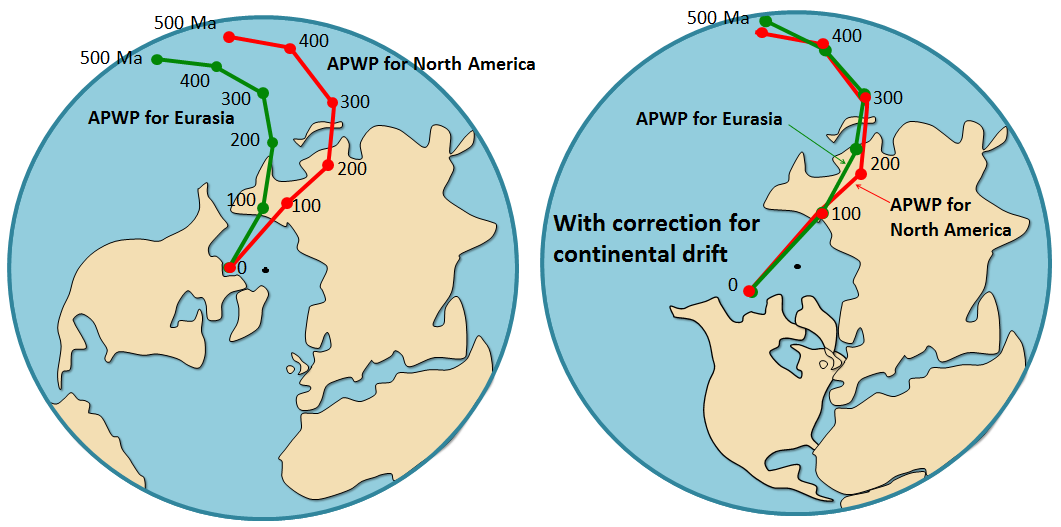
Applying the independently known relative motion between two continents — determined from the magnetic striping of the sea floor that spread between them — brings their separate apparent polar wander paths (APWP) into coincidence, confirming that the paths record real plate motions. In the same way, the continents can be rotated back through time in a mantle reference frame: one anchored to the deep mantle via the hotspot tracks, with the computed motions of the hotspots themselves taken into account. What remains after those rotations — the shared, residual wander of the pole — is the true polar wander path: the reorientation of the entire mantle relative to the spin axis. The view shown here is from the North Pole (black dot) looking down. The outer circle is the equator.
Figure courtesy of Earle, S, Physical Geology
Two Chains, One Plate: the Hawaiian-Emperor Chain and the Louisville Chain
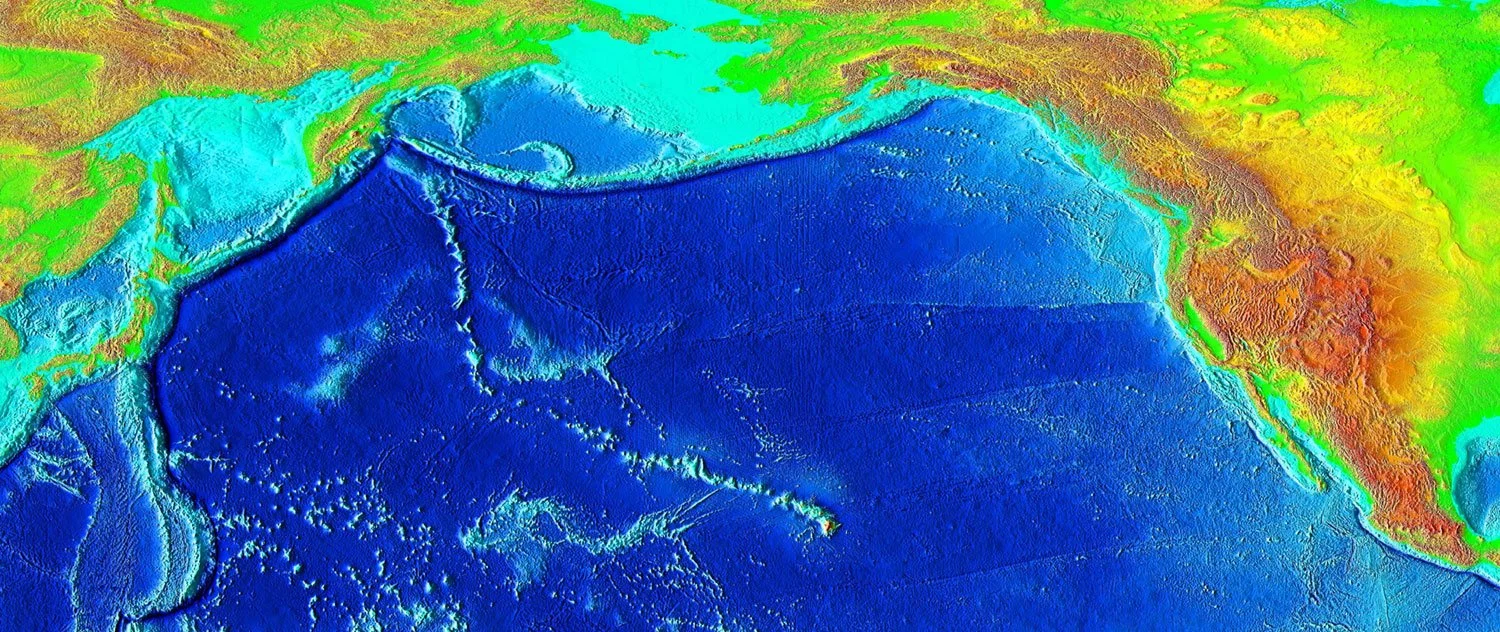
The Hawaiian-Emperor Chain, stretching some 6,000 km from the active volcanoes of Hawaii to 80-million-year-old seamounts on the verge of being subducted beneath Kamchatka. The chain's striking bend formed around 47 million years ago. It was long read as recording an abrupt change in the direction of Pacific plate motion, but paleomagnetic data from the Emperor Seamounts show that the hotspot itself drifted about 15° southward while that older portion of the chain was forming. As Steinberger explains in the podcast, neither a sudden change in plate motion nor a sudden halt in hotspot motion is easy to explain on its own — the sharpness of the bend seems to require both effects, coinciding.
Bathymetric rendering from Wikipedia / NOAA National Geophysical Data Center
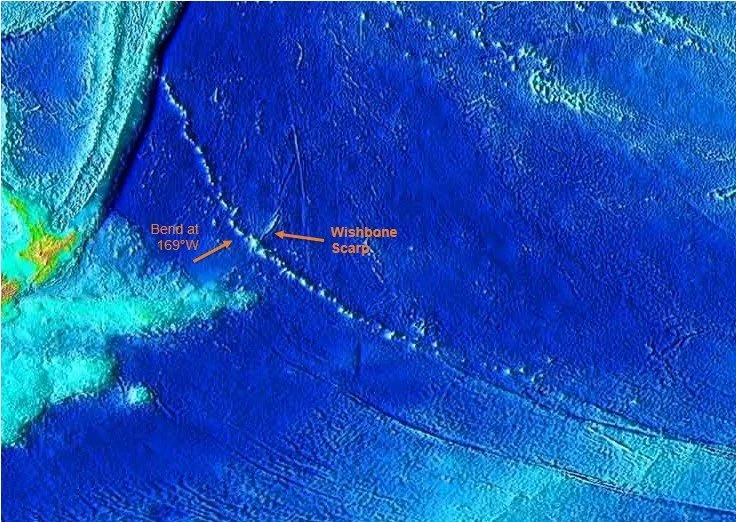
The Louisville seamount chain, the South Pacific counterpart of the
Hawaiian–Emperor chain, running about 4,300 km from near the Tonga–Kermadec
trench (upper left) to its recently active southeastern end. It rides the
same Pacific plate, so if the Hawaiian–Emperor bend were caused purely by a
change in plate motion, one might think Louisville should carry an equally
sharp bend of the same age. However, it is actually possible that plate
motion changed in a way that its counterpart bend — at 169°W, just southeast
of where the chain approaches the trench, where it crosses the Wishbone
Scarp — is subdued. This could occur if there is also plate rotation
with a rotation pole near the Louisville chain so it barely affects the Louisville
chain but has a big effect on the Hawaiian chain. The evidence for relative motion of the hotspots rather comes from age progression of the tracks, which is better explained if the
Hawaii hotspot moved southward relative to Louisville.
Bathymetric map from Wikipedia
Can a Model Reproduce Hotspot Tracks?

Hotspot tracks on the Pacific plate calculated from Steinberger's model of plumes advected in mantle flow, overlaid on the observed island and seamount chains with their radiometric ages. The model reproduces the geometry of the Hawaiian–Emperor, Louisville, and other Pacific tracks, including a bend about as sharp as the one observed. Getting that sharpness right constrains the mantle itself: it requires a low-viscosity layer beneath the Pacific plate, overlying a much stiffer lower mantle in which the plume conduits are anchored.
Steinberger & O'Connell (1998), Geophysical Journal International, 132, 412–434
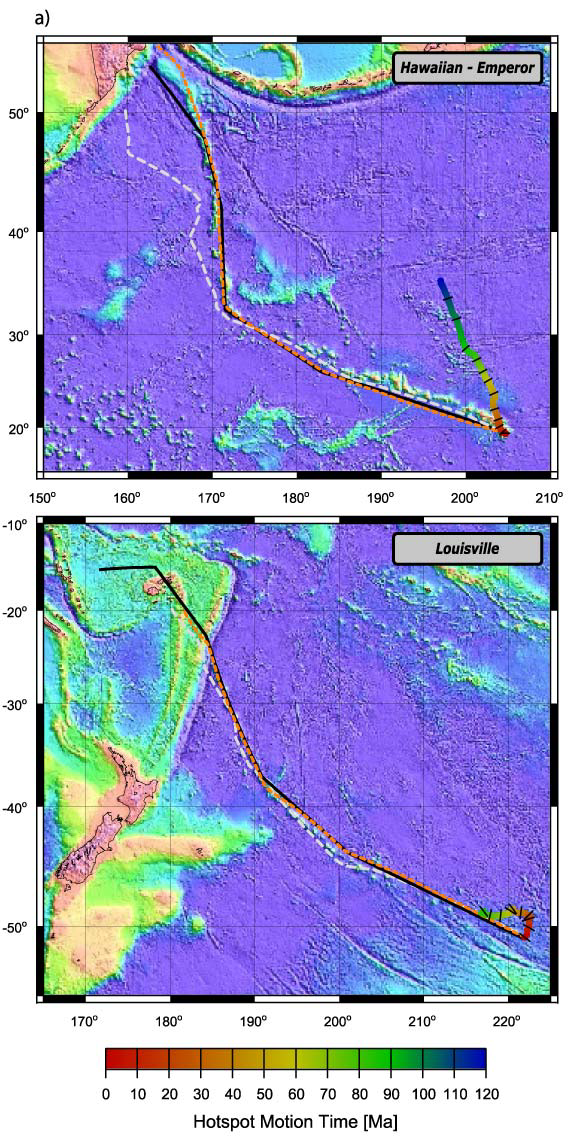
Computed tracks and hotspot motions for Hawaii (top) and Louisville (bottom), from mantle-flow models in which the hotspots are either fixed (black lines) or allowed to move (orange lines). The rainbow lines show the modeled drift of each hotspot over the past 120 million years; the orange lines show the resulting tracks. Both models account for the sharp bend in the Hawaiian–Emperor chain and the subdued bend in the Louisville chain. However the model with moving hotspots explains the age progressions along the tracks better: while the Hawaiian hotspot moved southward at about 35 mm per year before 47 million years ago, the Louisville hotspot drifted slowly eastward, shrinking the distance between the two by roughly 1,000 km. The two great Pacific hotspots did not move in concert — the clearest demonstration that hotspots are not fixed relative to one another.
Koppers, Duncan & Steinberger (2004), Geochemistry, Geophysics, Geosystems, 5, Q06L02
Motions of Individual Hotspots
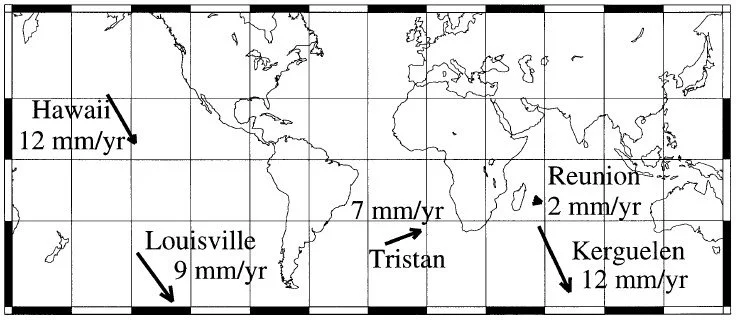
Predicted motions of the Hawaii, Louisville, Tristan, Réunion, and Kerguelen hotspots over the past 40 million years, from Steinberger's modeling of plume conduits advected in mantle flow. Each hotspot moves at around a centimeter per year, but in a direction and at a speed set by where it sits within the mantle's convection pattern — there is no rigid grid, and, as Steinberger cautions in the podcast, no neat division into a "Pacific group" and an "Atlantic group" either, although Pacific hotspots do tend to acquire a component of motion opposite to plate motion, driven by the mantle return flow caused by subducting slabs at depth. It is by computing motions like these, and building them into a “moving hotspot reference frame," that plate motions can still be tied to the deep mantle — the resolution of the episode's opening question.
Steinberger & O'Connell (1998), Geophysical Journal International, 132, 412–434
Net Westward Drift of the Lithosphere
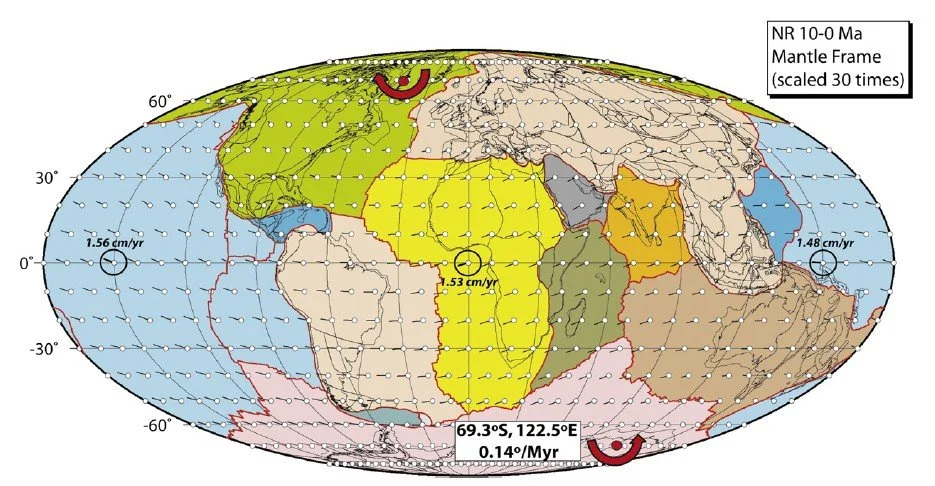
When the motions of all the plates are summed in a reference frame anchored to the deep mantle, the lithosphere as a whole turns out to rotate slowly westward — at about 1.5 cm per year at the equator, around a pole at high southern latitudes. The arrows show this net-rotation velocity field for the past 10 million years. In Steinberger’s view, this needs no exotic cause such as lunar tidal drag: it is dominated by the vast, fast-moving Pacific plate, hauled westward by the slabs subducting along its margins.
Torsvik et al. (2010), Earth and Planetary Science Letters, 291, 106–112
Imaging the Plumes
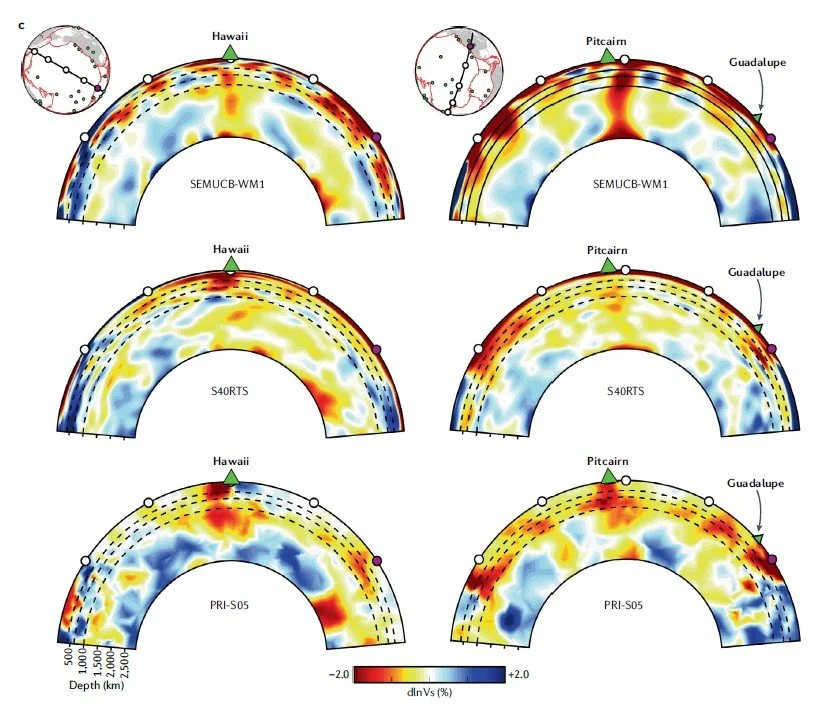
Whole-mantle seismic imaging now reveals the conduits beneath major hotspots directly — and they are not the thin tails of classical plume theory. The cross-sections beneath Hawaii and Pitcairn, comparing three generations of tomographic models, suggest conduits several hundred kilometers across, rooted at the core–mantle boundary and rising near-vertically through the lower mantle, with some deflected sideways above about 1,000 km depth as they enter the more vigorous circulation of the upper mantle. Their vertical trunks imply that flow in the deep mantle is even more sluggish than models had assumed — one reason hotspots stay as nearly fixed as they do. Sharpening these images, using arrays of ocean-bottom seismometers deployed around hotspots like Hawaii, La Réunion, and the Canaries, is the frontier Steinberger describes at the close of the podcast.
Koppers, A.A.P. et al. (2021), Nature Reviews Earth & Environment, 2, 382–401.). SEMUCB-WM1, S40RTS, and PRI-S05 are the names of the corresponding tomography models
Further Reading
Steinberger & O'Connell (1998), GJI 132, 412–434
Steinberger, Sutherland & O'Connell (2004), Nature 430, 167–173
Koppers, Duncan & Steinberger (2004), G³ 5, Q06L02
Torsvik et al. (2021), AGU Geophysical Monograph 263, ch. 16
Geology Bites Gillian Foulger episode (mantleplumes.org)